 Press Release
Auditor General Report Reinforces Consequences of Low Education Funding in Arizona
March 2, 2016Contact:
Dave Wells, Ph.D., Research Director
Grand Canyon Institute
dwells@azgci.org, 602-595-1025 ext. 3
Auditor General Report Reinforces Consequences of Low Education Funding in Arizona
Charter Schools have poorer ratio of Administration to Instruction than District Schools
The Auditor General Report on FY2015 School District Spending found classroom spending had reached a low ebb, but rather than blame districts, they correctly identified decreased funding, noting that teacher-pupil ratios are rising and teacher salaries declining:
Impact of declining classroom dollar percentage varies by district but can be seen state-wide in lower teacher pay and larger class sizes—Although the impact of a declining classroom dollar percentage varies by district depending on the cause of the decline, it is reflected state-wide in lower teacher pay and larger class sizes. Between fiscal years 2004 and 2015, the average teacher salary (adjusted for inflation) decreased 8 percent despite the teachers’ average years of experience staying about the same. More recently, between fiscal years 2010 and 2015, the state-wide average teacher salary decreased from $47,077 to $46,008 despite a 4 percent increase in the average years of teacher experience. During this same 5-year period, the state-wide average students per teacher increased from 17.9 to 18.6. (Auditor General, p. 1, https://www.azauditor.gov/sites/default/files/AZ_School_District_Spending_FY2015.pdf)
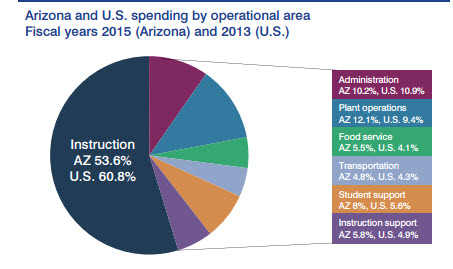
The Grand Canyon Institute in its early January analysis of Prop. 123 and the systemic underfunding of K-12 education focused on twenty years of census data on education appropriations along with data from the National Center for Educational Statistics. The Auditor General report is consistent with a long-standing pattern, especially which respect to the student-teacher ratio. Figure 1 shows that teacher salaries are about 10 percent below the national average as of 2012-2013. The Auditor General report suggests, since then, we have fallen further behind. Likewise, in 2012-2013 pupil-teacher ratios were 40 percent higher than the national average, a gap that has been growing and one that appears to have widened further from the Auditor General’s report. More detail on that GCI report can be found here: https://grandcanyoninstitute.org/a-fiscal-analysis-of-proposition-123-and-arizonas-underinvestment-in-k-12-education-an-essential-first-step-for-k-12-funding/
Figure 1
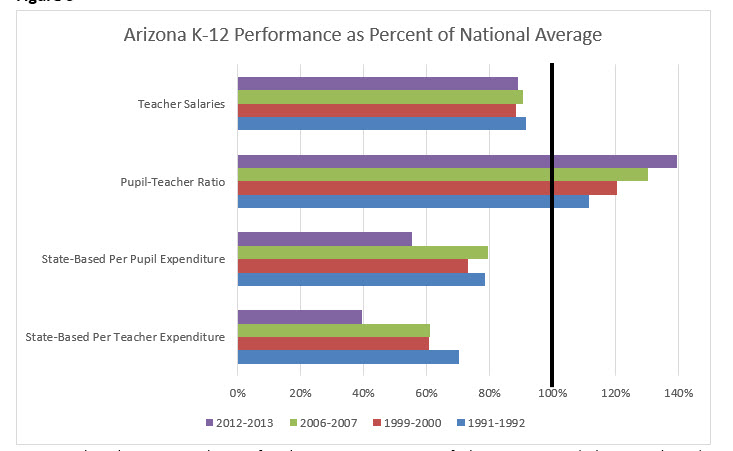
Sources: Selected years National Center for Education Statistics, Digest of Education Statistics (Salaries, Pupil Ratio) and Census Bureau Pubic School Finances (state-based financing). Per Teacher Expenditure derived from Pupil-Teacher ratio and state-based financing.
An area omitted from the Auditor General’s report is an analysis of charter schools. That should change. Charter schools should be required to submit their Annual Financial Reports to the Auditor General as well.
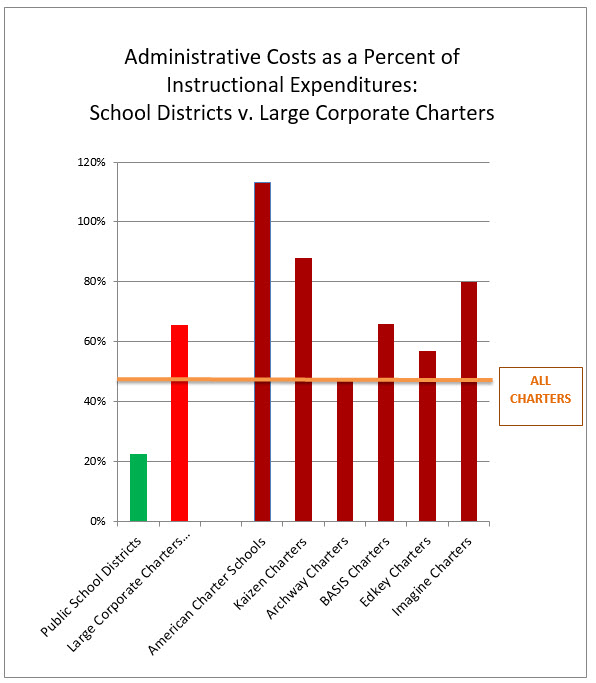
Ten days ago, Arizonans for Charter School Accountability and the Grand Canyon Institute released a comprehensive report that looked at administrative costs and administrative costs relative to instruction and found charter schools spent more than twice as much per pupil on administration with the worst offenders being large corporate charters that use for profit education management companies. Figure 2 notes that covering the added administrative costs taxpayers $128 million per year. Figure 3 shows that the large corporate charters spend about three times as much on administration relative to instruction as the public schools. Full details on that report is here: https://grandcanyoninstitute.org/higher-administration-charges-of-arizona-charter-schools-cost-taxpayers-128-million-a-year/
The Auditor General’s report includes a number of funding areas beyond Maintenance and Operations budgets that go to schools, consequently the overall funding analyzed in their report is higher for expenses than page 2 of the Annual Financial Reports submitted by Public Districts and Charters, so numbers in the two reports are not fully comparable. However, page 2 of Annual Financial Reports enabled the best fair comparison between Public School Districts and Charters.
Figure 2:
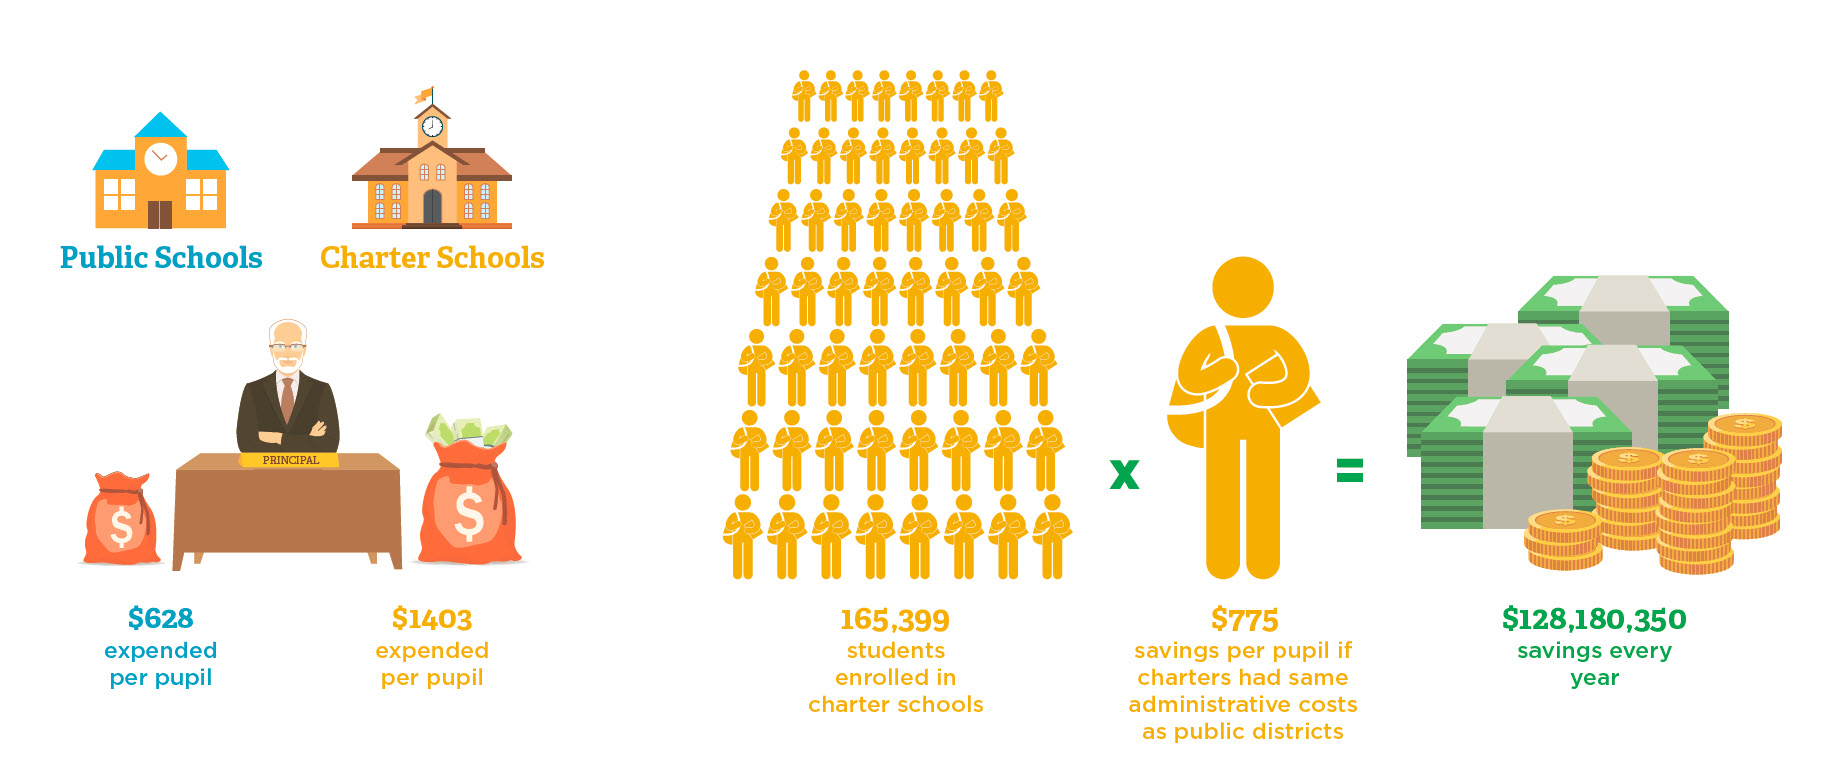
Figure 3: