 Budget
The Effects of Tax Reductions In Arizona
February 18, 2013The Effects of Tax Reductions In Arizona:
Significantly Reduced Government Revenue and No Apparent Impact on Economic Growth
Tom R. Rex
Fellow, Grand Canyon Institute
Executive Summary
Reductions in effective tax rates under certain conditions can result in gains in economic activity and increased government revenue. In practice, however, many supporters of “supply-side” economics ignore or misrepresent the “under certain conditions” clause and erroneously argue that all or most tax reductions will have a net beneficial impact.
Several limitations apply to supply-side economics, especially at a sub-national level:
- Most prominently, the “Laffer Curve” indicates that the benefits will occur only if the tax reduction is made to a tax rate that is higher than optimal. Reductions to lower-than-optimal tax rates will reduce government revenue.
- The relationship between taxes and economic growth and government revenue is much stronger for business taxes than for individual taxes.
- The reduction in one tax may not have much effect if the overall tax burden remains higher than optimal.
- State and local government taxes are a relatively small expense to businesses, and only the minority of businesses engaged in traded-sector activities can boost a region’s economic growth. Thus, only a small supply-side effect should be expected even if higher-than-optimal state and local government taxes are reduced to the optimal point.
- Even if all of the other conditions are met, if a state already is at full employment and has low commercial real estate vacancy rates when the tax reduction goes into effect, a net benefit to government finance will not be realized. In this case, labor will need to be imported to accommodate the faster economic growth, meaning that government expenditures must rise to serve the new residents.
In Arizona, the Legislature has repeatedly lowered state government taxes over the last two decades, usually with the justification that the reductions will be good for the economy and that the initial loss of revenue will quickly be made up by an increase in economic activity. However, Arizona has not been in a position to receive much in the way of supply-side benefits:
- Even in the early 1990s when the tax reductions began, the overall state and local government tax burden was not higher than average.
- Individual taxes have been disproportionately reduced. Even today, the business tax burden is average compared to the national norm while the individual tax burden is very low, relative both to other states and to Arizona’s historical norm.
- Most tax reductions have been passed in the midst of an economic expansion. Moreover, Arizona has not had an ongoing issue with underutilized resources (labor and physical space). Therefore, any increase in economic activity would necessitate an increase in government expenditures.
Thus, the tax reductions in Arizona should have had little effect on economic growth and should have reduced government revenue.
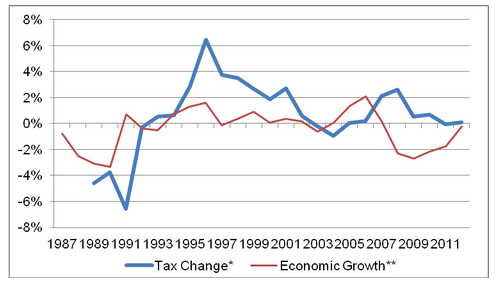
The empirical evidence in Arizona matches this conceptual conclusion. A correlation analysis indicates that the tax reductions have followed cyclical upswings in the economy that have created temporary revenue surpluses that allowed the tax reductions to occur while initially balancing the budget. This is seen in Figure E-1. Significant tax reductions occurred in each fiscal year from 1995 through 2001; the economy recovered from the recession in 1994 and was expanding rapidly by 1995. Large tax reductions also occurred in fiscal years 2007 and 2008; the economy had recovered from recession with strong growth in 2005 and 2006.
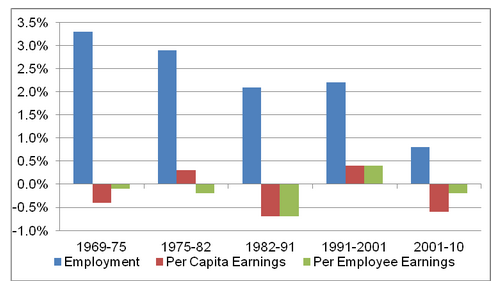
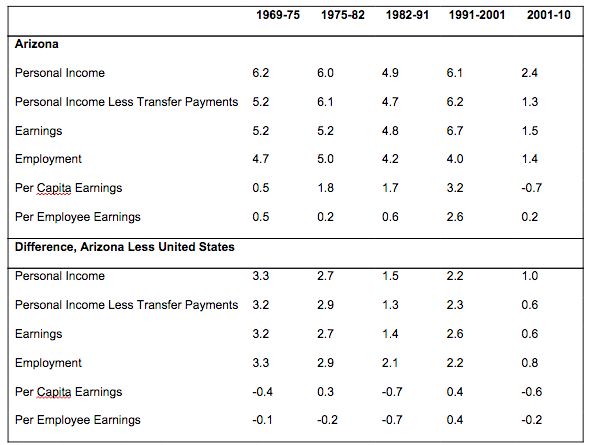
In the longer term, no positive economic response to the tax reductions can be perceived. Figure E-2 shows average annual growth in Arizona relative to the national average in each of the last five economic cycles for three economic measures: a measure of aggregate growth (employment), a measure of prosperity (per capita earnings), and a measure of productivity (per employee earnings). If the tax reductions boosted economic performance, the effect should begin to be seen in the 1991-to-2001 economic cycle, with a greater effect measured in the 2001-to-2010 cycle. Instead, of the last five economic cycles, employment growth was third highest in the 1991-to-2001 cycle and lowest in the 2001-to-2010 cycle. Prosperity and productivity gains were highest by a small margin during the 1991-to-2001 cycle, but losses during the 2001-to-2010 cycle were typical of earlier cycles.
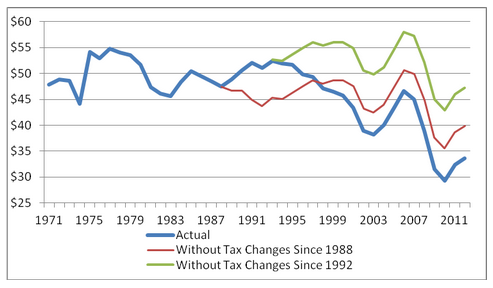
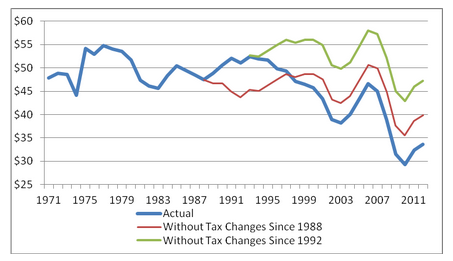
If economic growth does not accelerate to offset tax reductions, then government revenue relative to the size of the economy has to fall. This is shown clearly in Figure E-3, with sharp drops in actual revenue since the mid-1990s, when tax reductions began to go into effect. Had no tax code changes been made since 1992, revenues would have been substantially higher and similar to the historical norm.
Policy Paper
February 18, 2013
The Effects of Tax Reductions In Arizona:
Significantly Reduced Government Revenue and No Apparent Impact on Economic Growth
Tom R. Rex
Fellow, Grand Canyon Institute
Executive Summary
Reductions in effective tax rates under certain conditions can result in gains in economic activity and increased government revenue. In practice, however, many supporters of “supply-side” economics ignore or misrepresent the “under certain conditions” clause and erroneously argue that all or most tax reductions will have a net beneficial impact.
Several limitations apply to supply-side economics, especially at a sub-national level:
- Most prominently, the “Laffer Curve” indicates that the benefits will occur only if the tax reduction is made to a tax rate that is higher than optimal. Reductions to lower-than-optimal tax rates will reduce government revenue.
- The relationship between taxes and economic growth and government revenue is much stronger for business taxes than for individual taxes.
- The reduction in one tax may not have much effect if the overall tax burden remains higher than optimal.
- State and local government taxes are a relatively small expense to businesses, and only the minority of businesses engaged in traded-sector activities can boost a region’s economic growth. Thus, only a small supply-side effect should be expected even if higher-than-optimal state and local government taxes are reduced to the optimal point.
- Even if all of the other conditions are met, if a state already is at full employment and has low commercial real estate vacancy rates when the tax reduction goes into effect, a net benefit to government finance will not be realized. In this case, labor will need to be imported to accommodate the faster economic growth, meaning that government expenditures must rise to serve the new residents.
In Arizona, the Legislature has repeatedly lowered state government taxes over the last two decades, usually with the justification that the reductions will be good for the economy and that the initial loss of revenue will quickly be made up by an increase in economic activity. However, Arizona has not been in a position to receive much in the way of supply-side benefits:
- Even in the early 1990s when the tax reductions began, the overall state and local government tax burden was not higher than average.
- Individual taxes have been disproportionately reduced. Even today, the business tax burden is average compared to the national norm while the individual tax burden is very low, relative both to other states and to Arizona’s historical norm.
- Most tax reductions have been passed in the midst of an economic expansion. Moreover, Arizona has not had an ongoing issue with underutilized resources (labor and physical space). Therefore, any increase in economic activity would necessitate an increase in government expenditures.
Thus, the tax reductions in Arizona should have had little effect on economic growth and should have reduced government revenue.
The empirical evidence in Arizona matches this conceptual conclusion. A correlation analysis indicates that the tax reductions have followed cyclical upswings in the economy that have created temporary revenue surpluses that allowed the tax reductions to occur while initially balancing the budget. This is seen in Figure E-1. Significant tax reductions occurred in each fiscal year from 1995 through 2001; the economy recovered from the recession in 1994 and was expanding rapidly by 1995. Large tax reductions also occurred in fiscal years 2007 and 2008; the economy had recovered from recession with strong growth in 2005 and 2006.
In the longer term, no positive economic response to the tax reductions can be perceived. Figure E-2 shows average annual growth in Arizona relative to the national average in each of the last five economic cycles for three economic measures: a measure of aggregate growth (employment), a measure of prosperity (per capita earnings), and a measure of productivity (per employee earnings). If the tax reductions boosted economic performance, the effect should begin to be seen in the 1991-to-2001 economic cycle, with a greater effect measured in the 2001-to-2010 cycle. Instead, of the last five economic cycles, employment growth was third highest in the 1991-to-2001 cycle and lowest in the 2001-to-2010 cycle. Prosperity and productivity gains were highest by a small margin during the 1991-to-2001 cycle, but losses during the 2001-to-2010 cycle were typical of earlier cycles.
If economic growth does not accelerate to offset tax reductions, then government revenue relative to the size of the economy has to fall. This is shown clearly in Figure E-3, with sharp drops in actual revenue since the mid-1990s, when tax reductions began to go into effect. Had no tax code changes been made since 1992, revenues would have been substantially higher and similar to the historical norm.
FIGURE E-1
Comparing Tax Changes and Economic Growth In Arizona,
Fiscal Years 1987 Through 2012
Note: the temporary tax increase implemented late in FY 2010 is not included.
* The tax change is expressed as a percentage of state government general fund revenue. The sign on the tax change has been reversed to facilitate comparison between the two lines.
**Percentage-point difference between Arizona and the United States in the real per capita earnings percent change.
Sources: Calculated from Arizona Joint Legislative Budget Committee (tax change) and U.S. Department of Commerce, Bureau of Economic Analysis (earnings and gross domestic product implicit price deflator).
FIGURE E-2
Annual Average Inflation-Adjusted Economic Growth
By Economic Cycle, Difference Between Arizona and National Average
Source: Calculated from U.S. Department of Commerce, Bureau of Economic Analysis.
FIGURE E-3 Arizona State Government General Fund Revenue Per $1,000 Of Personal Income, Fiscal Years 1971 Through 2012
Sources: Arizona Joint Legislative Budget Committee (revenue and tax changes) and U.S. Department of Commerce, Bureau of Economic Analysis (personal income).
CONCEPTUAL BACKGROUND
Nearly any position on the relationship between state and local government taxes and economic performance is supported in the published literature. However, the bulk of the modern literature indicates that state and local government taxes have only a small effect on economic growth.
The impact is small because state and local government taxes are not that significant an expense to either households or businesses — in contrast to federal government taxes. For example, the National Bureau of Economic Research (NBER) estimates that the average marginal state individual income tax rate was 3.19 percent in 2010 in Arizona, while the combined federal and state rate was 23.48 percent.
Further, taxes merely represent the price paid for government services consumed, with many state and local government services — such as education, building and maintaining roads, and public safety — of high value to individuals and businesses alike.
State and local government tax burdens must be far out of line with competitor regions before much of an effect on the economy can be measured. For a state, a tax cut will have little effect on the economy unless the tax burden is comparatively quite high (especially versus competing states) and the tax reduction is very large. In general, tax policy is an inefficient way to stimulate the economy. Investments in infrastructure and education have been shown to have greater effects on economic growth.
Taxes as a Business Expense
Despite the attention given to taxes, state and local government tax payments are a small expense for most businesses. The Almanac of Business and Industrial Financial Ratios is based on information that is released by the Internal Revenue Service and derived from federal tax returns filed by businesses. It indicates that federal, state and local taxes combined — except for the federal income tax — account for only a little more than 2 percent of the operating income of the average business. Since this average includes many federal taxes, state and local government taxes are less than 2 percent of business operating income for the average business.
For perspective, the compensation of company officers is a larger expense than state and local government taxes for the average company. Therefore, the difference in effective state and local tax rates between states would have to be very large to have a noticeable effect on a company’s balance sheet.
Most companies serve the local population, selling their products to local customers. State and local government taxes do not have a competitive effect on these companies since their competitors are subject to the same taxes. In contrast, state and local government taxes are a factor for traded-sector companies — those that sell to customers around the country (and world). Since these companies can locate where they wish, state and local government taxes are one of the factors they consider in locating their facilities. However, state and local taxes rank well down the list of site location factors for such businesses, with factors such as cost, quality, and availability of labor and the availability and quality of the physical infrastructure far more important. Taxes receive attention because many state and local governments grant tax incentives, tax credits, and tax exemptions to businesses. A rational profit-seeking business will avail itself of such opportunities. However, in site location decisions, such tax breaks can be a deciding factor only if two or more locations are viewed essentially equally on all other factors.
The Laffer Curve and Supply-Side Economics
Supply-side economics is based on the concept that tax reductions stimulate economic growth, with the stimulus so great that government revenue rises despite the lower tax rates. The economist Arthur Laffer brought this relationship into the popular literature in the 1970s. Initially, his focus was national tax rates, particularly the federal income tax, which was quite high in the 1970s, but the “Laffer Curve” applies to state and local tax rates as well. In reality, the Laffer Curve is a mathematical relationship (Rolle’s Theorem), the analytical foundations of which were established centuries ago.
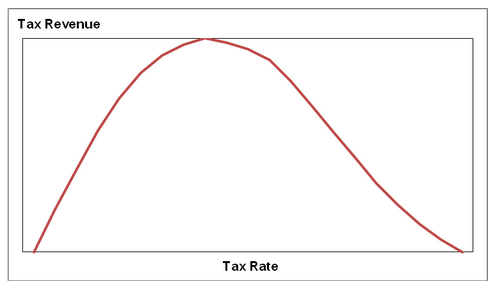
The concept is simple. A single tax rate produces the greatest government revenue. Setting rates below this optimal point leaves governments with less than maximum revenue but setting rates higher than the optimal point has a negative impact on economic activity, which results in lower tax collections despite the higher tax rate. The relationship between tax rates and revenue collected follows a curve (see Figure 1). The exact shape of the curve can vary by specific circumstances, but the end points always are the same: No tax results in no public revenue while a 100 percent tax rate would cause all legal economic activity to cease.
FIGURE 1 ILLUSTRATIVE LAFFER CURVE
Source: Author’s illustration.
While the general concept of supply-side economics and the Laffer Curve is simple and based on a mathematical relationship, it has a number of limitations:
- In real-world application, it is difficult to identify the tax rate that constitutes the optimal point and to describe the exact shape of the Laffer Curve.
- The relationship may not hold when considering the effective rate of one type of tax. For example, if a region’s overall tax burden is higher than optimal, lowering the effective tax rate on one type of tax from higher than to optimal may not generate much of an economic effect if the overall tax burden remains higher than optimal.
- The relationship between taxes and economic growth/government revenues is much stronger for business taxes than for individual taxes.
- Since state and local government tax payments are small relative to federal tax payments and to other expenses, a decrease in a state or local tax rate that is higher than optimal will have a relatively small supply-side effect.
- If a regional economy is at full capacity (unemployment rate is low, business and industrial building vacancy rates are low), then a boost to the economy from a reduction in taxes will not have a net positive effect on government finances. To accommodate the increase in economic growth, more people will have to move to the region to fill the new jobs created. Thus, while government revenues may increase, public expenditures will increase as well in order to serve the new residents and businesses.
The Laffer Curve demonstrates that when an effective tax rate is higher than optimal, a tax reduction can result in increased government revenue. If an effective tax rate is optimal or less than optimal, however, a tax reduction will result in a decrease in government revenue. This distinction has been lost in many discussions of taxation. Some proponents of limited government erroneously argue that tax rates are always higher than optimal and that reduced taxation always is beneficial.
Application to State and Local Economies
States compete for traded-sector economic activity that is mobile (not tied to a particular place as in the case of a mine). Capital and labor can move easily throughout the country. Under these conditions, the optimal tax rate for state and local government taxes might be considered to be the average among the states. If the rate is higher, a state could on average lose traded-sector economic activities to other states. If the rate is lower, any additional economic activity gained will not offset the lower tax collections from all existing individuals and businesses.
While tax rates may influence capital and labor mobility across the states and give rise to Laffer-type effects, capital and labor move for a host of reasons. The amount and quality of public infrastructure (such as airports, roads, and schools) available in a region — amenities supported by state and local government tax revenue — are among the factors strongly influencing economic growth. So, an alternative definition of the optimal tax rate in a state is the rate that allows sufficient investment in public amenities that foster economic growth without imposing tax burdens that negatively affect the economy.
For a state or local government tax reduction to result in much of a positive effect on economic growth and government revenue, the prior tax rate must have been very high and the new tax burden must be near the optimal point. A much greater economic impact is likely from a reduction in business taxes meeting these criteria than in a reduction in personal taxes. One business decision (for example, in site selection) can affect many workers but few individuals would decide to start a traded-sector business that would employ many workers based on a reduction in individual taxes. Instead, a tax reduction to individuals primarily results in an increase in consumer spending, whose positive effect on the local economy is negated by the offsetting reduction in government expenditures.
Further, for a net positive effect to accrue to government finance from a state or local government tax cut, the state must have underutilized resources. For example, if a state with higher-than-optimal tax rates also has high unemployment and high commercial and industrial vacancy rates, then a reduction in taxes to near the optimal point might stimulate economic growth, putting more residents to work and more highly utilizing existing facilities. Since labor to support the faster economic growth would not have to be imported to the state, population growth would not accelerate. Thus, the increase in government revenue would not be offset by the need to increase public spending to support new residents. The need for government expenditures could fall as unemployed people find jobs and stop using public welfare programs.
But in Arizona, high unemployment rates and high commercial/industrial vacancy rates occur only during economic recessions. At other times, Arizona’s labor force and physical resources are fully utilized. Thus, the majority of jobs created in Arizona are filled by labor imported into the state from other states and other countries. Even assuming that tax cuts in Arizona did have a positive effect on economic growth and government revenue, the requirement of excess capacity is not met in order for a net benefit to government finance to accrue. If lowered taxes stimulated the Arizona economy further, then even more labor would have to be imported into the state, both for the construction of the facilities needed to house these economic activities and for the permanent employment created. Thus, while public revenue might increase, the need for public spending also would rise. Unless the incomes of the imported workers were above the existing average, taxes paid by new residents would not cover the costs of providing them with public services, particularly if the workers have children educated in public schools.
Value of Public Services
Over time, some supply-side enthusiasts have moved to a position that any tax cut is good for the economy and enhances public revenue — which violates the Laffer Curve. Moreover, the idea that lower taxes always are better ignores the purpose of taxation.
Taxes are the price paid for a service that is publicly provided. Particularly at the state and local level, many government services directly impact residents and businesses: education, water provision and sewer services, collection of trash, building and maintaining roads, police and fire protection, the judicial system, the correctional system, etc. Many public services — particularly education (kindergarten through graduate school) and the physical infrastructure — are of key importance to businesses, particularly high-technology and other traded-sector companies. For these types of companies, the provision of public services is more important than the level of taxes. Thus, business climate benefits from investment in various public programs.
Empirical evidence exists that public infrastructure plays a role in increasing business investment, job creation, and economic growth. Similarly, tax reductions financed by cutting education, infrastructure spending, and other services valued by businesses likely will have a negative effect on economic performance.
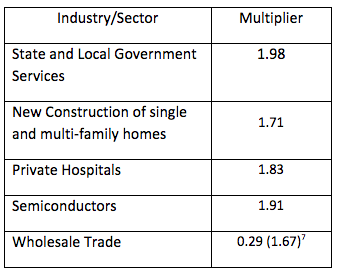
One argument sometimes used to justify tax reductions is that taxes remove money from the economy. In reality, tax revenue is spent in much the same way as revenue received by a company: paying employees, purchasing materials from the private sector, etc. On average, a higher portion of public-sector spending is for personnel while private-sector firms spend a higher portion of their revenue on raw materials and manufactured goods, much of which must be purchased from outside the region. Because of this, public-sector expenditures stay within the state’s economy to a greater extent than private-sector expenditures. In other words, the in-state multiplier effect is higher for public-sector spending than for private-sector spending.
To illustrate varying multiplier effects, IMPLAN software was used to model impacts on the Arizona economy of an increase in exogenous economic activity for particular sectors. Multipliers illustrate the degree money re-circulates within the state’s economy to generate economic growth. For simplicity, these are assumed to be pure increases independent of any factor. State and Local Government Services provide the greatest multiplier effect.
EMPIRICAL EVIDENCE IN ARIZONA
This section begins with a review of the tax burden in Arizona relative to the national average and to other states, which is followed by a detailed review of the changes in tax policy in Arizona since the 1970s. Then, the empirical relationships in Arizona between tax changes and economic growth and tax revenue are examined.
Tax Burden
One means of comparing overall tax burdens — including taxes paid by businesses and by individuals — over time and across states is to divide the tax revenues reported by the U.S. Census Bureau by personal income. On this basis, the overall tax burden in Arizona dropped 21 percent between 1993 and 2010, going from 7 percent above the U.S. average to 13 percent less.
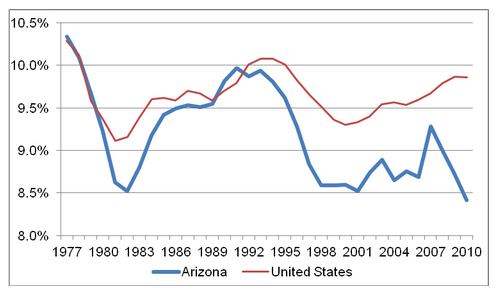
By state, the Tax Foundation produces an alternative measure of the overall tax burden using similar methodology, with annual data available from 1977 through 2010. Their tax burden is calculated as per capita total state and local government taxes paid by state residents and businesses divided by the per capita income in the state. Nationally, all state and local government taxes have accounted for less than 10 percent of income in every year since 1996 (see Figure 2).
FIGURE 2 OVERALL TAX BURDEN IN ARIZONA AND THE NATION, 1977 THROUGH 2010
Source: Tax Foundation (http://taxfoundation.org/article/arizonas-state-and-local-tax-burden-1977-2010).
Since 1980, the tax burden in Arizona has been lower than the national average in every year except 1990 and 1991. In 2010, Arizona’s tax burden of 8.4 percent compared to 9.9 percent nationally. Arizona’s tax burden in 2010 was 40th highest among the 50 states — only 10 states had a lower tax burden. Arizona had ranked as high as 17th in 1990 and 18th in 1977 and 1991. Among 10 western states, Arizona ranked eighth in 2010, with Nevada and Texas having a lower overall state and local government tax burden. On a per capita basis without considering income, Arizona ranked 44th in state and local government taxes paid in 2010. Among the 10 western states, only New Mexico was lower.
Since the business tax burden is much more closely tied to economic performance than the individual tax burden, it is important to distinguish between these tax burdens. The business tax burden by state has been estimated in recent years by Ernst & Young, with their annual report produced for the Council on State Taxation. In order to compare states, Ernst & Young calculates the amount of business taxes paid in a state relative to the state’s gross domestic product (GDP) contributed by the private sector.
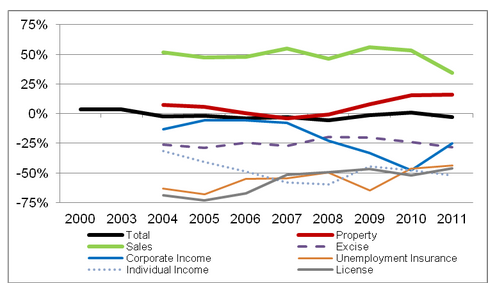
The overall business tax burden in Arizona between 2000 and 2011 fluctuated from 4 percent higher to 5 percent less than the national average, with no trend over time (see Figure 3). Since 2004, Ernst & Young has reported the amount paid in each of seven categories of business taxes. In Arizona, the property tax (the largest category) and the sales tax combined have accounted for between 71 and 77 percent of the business taxes paid in each year. In most years, the property tax burden has been close to the national average, but it was 16 percent higher in 2010 and 2011. The sales tax burden has been considerably higher than the national average, by 34 percent in 2011. In contrast, the tax burden in each of the other categories has been far less than the national average. In 2011, the differentials were 25 percent for the corporate income tax, 28 percent for excise taxes, 44 percent for the unemployment insurance tax, 46 percent for license taxes, and 52 percent for the individual income tax. Businesses that are not corporations pay the individual income tax; only one-fourth of the income taxes paid by businesses between 2004 and 2011 were paid by businesses reporting on the individual tax form; they accounted for only one-eighth of the total individual income tax revenues.
One means of measuring the individual tax burden is to subtract the business taxes estimated by Ernst & Young from the total taxes reported by the Census Bureau and then divide by personal income. On this basis, the individual tax burden in Arizona was 25 percent less than the U.S. average in 2010. The sales tax burden was greater than average but the burden in every other tax category was below average, including a differential of nearly 50 percent on the individual income tax and 33 percent on the property tax.
The government of the District of Columbia provides another way to measure the individual tax burden. In its annual report, Tax Rates and Tax Burdens in the District of Columbia: A Nationwide Comparison, the amount of taxes paid in a large city in each state and in the District of Columbia by households at each of five income levels are compared and the tax burden as a percentage of income is calculated. Most state and local government taxes are included in one of four tax categories: income, property, sales, and automobile related.
FIGURE 3
BUSINESS TAX BURDEN IN ARIZONA RELATIVE TO THE NATIONAL AVERAGE, 2000 THROUGH 2011
Source: The Council on State Taxation and Ernst & Young, Total State and Local Business Taxes, annual report (http://www.cost.org/StateTaxLibrary.aspx?id=17768).
In 2011, Phoenix ranked between 38th and 40th among the 51 cities at each of the three highest income levels ($75,000, $100,000 and $150,000) and 33rd at the $50,000 level. (The data at the $25,000 income level are unreliable.) Averaged across these four income levels, the amount of taxes paid in Phoenix was about 16 percent less than in the average city. The income tax burden was less than half as large, and the property tax burden was less than two-thirds as much, as in the average city, but the sales tax burden was nearly twice as high as average.
In 2010, Arizona’s overall tax burden was 15 percent less than the national average according to the Tax Foundation and 13 percent less based on the Census Bureau data. The individual tax burden was 25 percent less based on the difference between the Census Bureau and Ernst & Young data; the individual burden was about 16 percent below average according to the District of Columbia study (in 2011). In contrast, the business tax burden was 3 percent higher than the U.S. average according to the Ernst & Young study. The business tax burden likely will compare more favorably in a few years, once the business tax cuts passed during the last two years begin to be phased in.
Tax Changes in Arizona
This subsection concentrates on changes in state government tax policy since the late 1970s but data also are provided for combined state and local government taxes. Four measures of Arizona taxes are examined in this subsection:
- State government general fund tax revenue reported by Arizona’s Joint Legislative Budget Committee (JLBC) for fiscal years (FYs) 1971 through 2012, expressed per $1,000 of personal income. The fiscal year runs from July 1 through June 30.
- Beginning in FY 1989, the JLBC has estimated the revenue impact to the state government general fund of every state government tax law change, expressed in unadjusted dollars.
- Total state and local government tax revenue reported by the U.S. Census Bureau for fiscal years 1970 through 2010, expressed per $1,000 of personal income. The figures for Arizona can be compared to the national average and to other states.
- The Tax Foundation’s tax burden measure, which is based on alternative measures of state and local government taxes paid and per capita income, available for fiscal years 1977 through 2010. Arizona can be compared to the nation and to other states.
All of the measures express the tax changes as of the year(s) in which they become effective. Since changes in tax policy often have been delayed and/or phased in, the date at which the changes have been passed by the Legislature is less important than the time at which they become effective. For example, tax reductions passed by the Legislature in early 2011 do not begin to phase in until FY 2014 and are not complete until FY 2019.
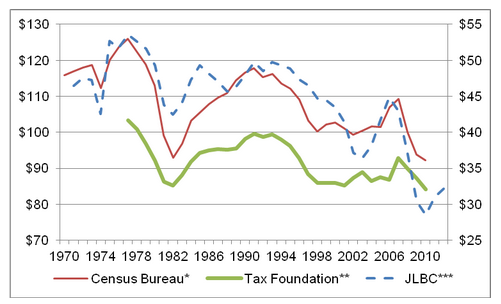
The first, third and fourth measures, each of which are based on total tax revenue, are displayed in Figure 4. For Arizona, the correlation (for fiscal years 1977 through 2010) is very high (.92) between the Tax Foundation’s measure and the Census Bureau’s measure, though the Tax Foundation’s measure does not display as much range. Even the correlations between the JLBC’s figure for the state government general fund and the other two measures of total state and local government tax collections are high: .74 with the Tax Foundation and .82 with the Census Bureau. Since the early 1990s, tax revenue to the state’s general fund displays considerably more cyclicality, and has dropped more substantially, than the other two measures. Most of the tax reductions in Arizona over the last two decades have affected the state’s general fund.
Chronology of Changes to Tax Policy
A series of major tax law changes were made from 1979 through 1984. Lower property taxes were implemented in fiscal years 1979 and 1980. Effective in FY 1981, the sales tax on food to be consumed at home was eliminated. Due to these tax cuts and a weak economy, tax revenues fell sharply through FY 1982, as seen in all three measures displayed in Figure 4. In order to balance the budget, the Legislature increased the general sales tax rate, effective in FY 1984.
After this tax increase, the tax burden in the mid-to-late 1980s still was noticeably less than in the late 1970s. Based on the Tax Foundation’s measure, Arizona’s tax burden fell from more than 10 percent ($100 in Figure 4) and about equal to the national average in the late 1970s to 8.5 percent and below average in the early 1980s. In the mid-1980s, the tax burden rose to 9.5 percent, slightly less than average.
Arizona’s economy slowed significantly during the late 1980s, lowering tax collections to the state’s general fund and revealing a structural deficit. The Legislature responded by both reducing spending and increasing revenue. Tax increases were implemented in Arizona from fiscal years 1989 through 1992, though predominantly from FYs 1989 through 1991.
According to the JLBC, the tax increases between FYs 1989 and 1992 summed to $449 million (in nominal terms). A variety of taxes were increased, with the individual income tax accounting for half of the total. Adjusting for the state’s population growth, real per capita economic growth, and inflation, the tax increases are estimated to have raised tax revenues by $494 million in FY 1992. These increases returned the tax burden to the level of the 1970s, though not as high as the peak in FY 1977. According to the Tax Foundation, the tax burden rose during this period, but only to 10 percent. Since tax increases occurred in many other states from FYs 1990 through 1992, Arizona’s tax burden only briefly exceeded the national average.
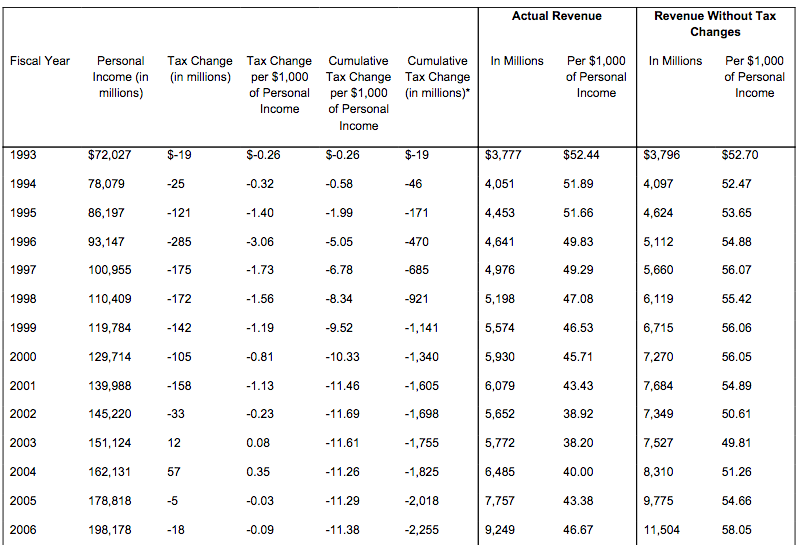
Reductions in taxes began to be implemented in Arizona in fiscal year 1993 but were insignificant until FY 1995 (see Table 1). Substantial tax decreases were implemented from FYs 1995 through 2001. According to the JLBC, the tax reductions from FYs 1993 through 2001 totaled $1.2 billion (in nominal terms). Adjusting for the state’s population growth, real per capita economic growth, and inflation, the tax increases in FYs 1989 through 1992 were more than offset by FY 1998. Revenues in FY 2001 are estimated to have been $1.7 billion lower than they would have been had no tax reductions been made.
While a variety of taxes were reduced from FYs 1993 through 2001, half of the total impact came from individual income tax reductions. Reductions in the corporate income tax were slow to be made — it was not until FY 2001 that the corporate income tax increases from FYs 1989 through 1991 were offset.
FIGURE 4 MEASURES OF TAX BURDEN IN ARIZONA, FISCAL YEARS 1970 THROUGH 2012
* The Census Bureau value (use the left scale) is for state and local governments, expressed as tax revenue per $1,000 of personal income.
** The Tax Foundation value (use the left scale) is for state and local governments, expressed as an alternative measure of taxes paid per $1,000 of an alternative measure of income. It is multiplied by 1,000 to put it on the same scale as the Census Bureau data.
*** The JLBC value (use the right scale) is limited to the state government general fund, expressed as tax revenue per $1,000 of personal income.
Sources: Calculated from the Tax Foundation, Arizona Joint Legislative Budget Committee, and U.S. Department of Commerce, Census Bureau. Personal income is from the U.S. Department of Commerce, Bureau of Economic Analysis.
TABLE 1
TAX CHANGES IMPLEMENTED SINCE FISCAL YEAR 1993, ARIZONA STATE GOVERNMENT GENERAL FUND
* Calculated as the cumulative tax change relative to personal income multiplied by personal income.
Sources: Arizona Joint Legislative Budget Committee (tax change and actual revenue) and U.S. Department of Commerce, Bureau of Economic Analysis (personal income).
The Census Bureau’s and Tax Foundation’s measures fell considerably between 1993 and 2001, with the latter dropping from 10 percent (approximately equal to the national average) to 8.5 percent (0.8 percentage points less than the U.S. average). Due to the narrowing of the tax base used for the state’s general fund and due to the high cyclicality of the increasingly predominant tax sources (sales tax and income tax), tax revenues to the state’s general fund began to swing wildly with the economic cycle, dropping sharply during recessions.
Changes in tax policy implemented from FYs 2002 through 2006 were minor. According to the Tax Foundation and the Census Bureau, the tax burden was relatively stable during these years. However, due to cyclical factors, state government general fund revenues jumped between FYs 2004 and 2006, after falling sharply between FYs 2000 and 2003.
Despite the limited changes to the tax code from FYs 2002 through 2006, the effect of the cumulative tax cuts since FY 1993 had grown to nearly $2.3 billion in FY 2006 after adjusting for the state’s population growth, real per capita economic growth, and inflation.
Significant additional tax reductions occurred in FYs 2007 and 2008, with lesser reductions implemented in FYs 2009 and 2010. According to the JLBC, the tax reductions over these four years summed to $489 million (in nominal dollars). The cumulative impact of the tax cuts from FYs 1993 through 2010 reached $2.9 billion in FY 2010. According to the Tax Foundation, Arizona’s tax burden fell during this period to a historical low of 8.4 percent in FY 2010, nearly 1.5 percentage points less than the U.S. average. (As measured by the Tax Foundation and Census Bureau, Arizona’s tax collections increased in FY 2007 — not because of a tax increase but rather due to a surge in tax collections even after adjusting for gains in personal income, in part due to capital gains that resulted from the real estate boom.)
In fiscal year 2012, the effect of the tax changes implemented since FY 1993 is estimated to have reduced revenues by $3.1 billion after adjusting for the state’s population growth, real per capita economic growth, and inflation since each tax change was implemented. More than half (56 percent, $1.75 billion) of the total decrease has been due to reductions in the individual income tax. The shares (and dollar decline) in other categories are 14 percent ($441 million) in the sales tax, 13 percent ($402 million) in the property tax, 10 percent ($308 million) in the corporate income tax, and 8 percent ($245 million) in other taxes.
Conceptual Applicability to Supply-Side Effects
All four of the measures examined indicate that significant reductions in Arizona’s tax burden have been implemented since FY 1993 and that the current tax burden is significantly lower than the state’s historical norm (prior to the mid-1990s). The question is whether these tax reductions stimulated economic growth and thereby boosted government revenues. Conceptually, given the level of taxes just prior to the start of the reductions and given the nature of the tax reductions, such a supply-side effect should not have occurred.
First, looking at the overall state and local government tax burden, Arizona’s tax burden in the early 1990s was marginally less than the national average. Assuming the optimal tax rate on the Laffer Curve is equal to the national average, this suggests that the tax reductions in Arizona should have had little effect on economic growth and should have reduced government revenues by about the estimated amount of the tax reductions.
Second, it also is useful to examine the specific tax reductions and whether the specific tax burdens were higher than optimal before the tax reductions began. In particular, relatively few of the tax reductions implemented through FY 2012 were targeted to businesses, though some of the reductions applied to businesses as well as to individuals. The disproportionate emphasis on individual taxes caused the individual tax burden to fall far below average while the business tax burden remained at the national average. Conceptually, this mix of tax cuts minimizes any possible supply-side effects from the large overall tax reductions.
Specific taxes can be examined using both of the tax measures produced by the JLBC as well as the Census Bureau dataset. In addition, the individual income tax can be examined using a dataset from the late 1970s through 2010 produced by the National Bureau of Economic Analysis (NBER). The NBER has estimated the average marginal state income tax rates for various types of income. Focusing on the tax rate applicable to wages, Arizona’s marginal rate annually was above the national average in the 1980s, with Arizona ranking in the teens among the states. The marginal rate peaked in 1989. Since other states increased income taxes in the 1990-to-1992 period, Arizona’s marginal rate fell below the national average and ranked in the 30s even before the first individual income tax reduction of the 1990s was passed. The other datasets verify that Arizona’s individual income tax burden in the early 1990s was less than the average of the states. Using the Laffer Curve, this suggests that the individual income tax cuts in Arizona since that time should have decreased, not increased, government revenue. Conceptually, it is unlikely that these tax cuts had much of an effect on the state’s economic performance.
Like the individual income tax, the property tax rate in Arizona already was relatively low in the early 1990s, so reductions in the property tax were unlikely to have had any positive effect on government revenue or economic performance. The vehicle license tax rate was near the middle of the states, so this tax cut also is unlikely to have had much of any positive effect.
In contrast, the general sales tax rate in Arizona was considerably above average, so the reductions in the sales tax potentially had a positive effect. Most of the reductions occurred between FYs 1995 and 1998, resulting from a decrease in the commercial lease rate and the passage of numerous sales tax exemptions. Similarly, the corporate income tax rate was relatively high before tax cuts were implemented in the early 2000s and late 2000s.
While the reductions in the sales tax and corporate income tax might have generated a Laffer Curve effect, the magnitude of any benefit conceptually should have been small based on various considerations: though these taxes were high, the overall tax burden was not high; less than one-fourth of the total tax reductions were to these taxes; the sales tax burden remains very high; the corporate tax reductions in the early 2000s were small in magnitude; and the very small scale of the tax cuts from the perspective of the size of all business expenses. Further, with most of these cuts being implemented when Arizona’s economy was booming, any economic stimulus created by the cuts would have resulted in an increase in the importation of labor to the state and therefore a rise in government expenditures offsetting any gains in public revenues.
Thus, the size, nature and timing of the tax cuts in Arizona, combined with the conceptual basis for supply-side economics, suggest that little positive effect either on economic growth or on government revenue should have occurred as a result of the tax reductions implemented since FY 1993. The next two subsections examine the empirical data on economic growth and government revenue to see if a positive effect of the tax cuts, or a negative effect of the preceding tax increases, is perceptible.
Tax Changes and Economic Growth
In order to examine the empirical relationship between changes in tax policy (reductions and increases in effective tax rates) and economic performance, tax changes in Arizona since the late 1970s are compared to the state’s economic growth and to the state’s economic growth relative to the national average. The difference between the state and national percent change in economic growth is the superior measure, since the ups and downs in economic growth that equally affect the nation and Arizona are accounted for in this way.
Various measures of economic performance can be compared to the tax data, but since the tax data are produced on a fiscal year basis, it is ideal for the economic data to be on that basis as well. Gross domestic product is the broadest measure of economic performance but is available by state only on a calendar year basis and is not available on an inflation-adjusted basis prior to 1987. Personal income is available quarterly, allowing it to be calculated on a fiscal year basis, but personal income includes income not earned in the period received, such as Social Security retirement benefits. Thus, personal income is better suited as a measure of economic well-being than economic performance. The earnings component of personal income is the broadest measure of economic performance available on a quarterly basis. The earnings and tax data are adjusted for inflation using the quarterly GDP implicit price deflator. The deflator and each of the economic measures are produced by the U.S. Bureau of Economic Analysis (BEA).
Correlations
Correlations have been calculated between the annual change in taxes (with a tax reduction recorded as a negative value) as estimated by the JLBC and the percent change in annual earnings. The time period covers the tax changes implemented from FY 1989 through FY 2010. The tax change is measured in two ways: in dollars and as a share of tax revenue in the year in which the tax change is implemented. Earnings also is measured in two ways: the percent change in Arizona and the difference in the percent change in Arizona and the national average. All dollar measures have been adjusted for inflation. Correlations have been calculated based on aggregate measures of economic growth and taxes as well as on a per capita basis.
Not much difference was found between the correlations based on aggregate measures and those on a per capita basis; the per capita correlations are cited below. As expected conceptually, correlations are considerably higher when measuring economic growth as the difference in the Arizona and national economic growth rates.
In order to provide an indication of possible causal relationship, five sets of correlations have been produced: with the change in earnings leading the change in taxes by two years and by one year, with the changes in taxes and earnings occurring in the same year, and with the change in taxes leading the change in earnings by one year and by two years. If tax changes have had an effect on economic performance, one would expect the highest correlations to be between tax changes in one year and economic growth in a subsequent year. Instead, the highest correlations occur when economic growth leads the tax changes.
FIGURE 5
COMPARISON BETWEEN TAX CHANGES AND ECONOMIC GROWTH IN ARIZONA, FISCAL YEARS 1987 THROUGH 2012
Note: the temporary tax increase implemented late in FY 2010 is not included.
* The tax change is expressed as a percentage of state government general fund revenue. The sign on the tax change has been reversed to facilitate comparison between the two lines.
**Percentage-point difference between Arizona and the United States in the real per capita earnings percent change.
Sources: Calculated from Arizona Joint Legislative Budget Committee (tax change) and U.S. Department of Commerce, Bureau of Economic Analysis (earnings and gross domestic product implicit price deflator).
The correlation between economic growth in one year and the tax change in the following year is -.75 measured in dollars and -.74 when the tax change is measured as a share of general fund tax revenue. The correlations are only a little lower (-.68 and -.67) when the change in earnings leads the tax change by two years. Economic growth leads because tax law changes take effect in subsequent fiscal years from when they are passed. For example, economic growth in the last economic cycle peaked in FY 2006 (July 1, 2005 through June 30, 2006). In the legislative session of FY 2006 (in spring 2006), a tax reduction was passed, but was not implemented until FYs 2007 and 2008. The annual pattern of per capita economic growth and tax changes is illustrated in Figure 5, with the sign of the tax changes reversed to ease the comparison of the two lines.
In contrast, the correlations are only -.39 when the earnings change and tax change occurs in the same year. The correlation disappears when the tax change leads the earnings change.
This is very strong evidence that economic performance leads the changes in tax policy. When the economy is strong, surpluses in the general fund are realized, allowing taxes to be cut while still balancing the budget as required by the Arizona Constitution. When the economy is weak, budget deficits occur: either tax cuts have been small or tax increases have occurred. Thus, there is no indication that the tax increases from FYs 1989 through 1992 harmed the economy, nor is there any evidence that the tax reductions since FY 1993 have benefited the economy.
Economic Growth and Tax Changes Over Time
In order to examine the relationship between economic growth and tax changes more closely, a year-by-year comparison follows. When examining economic growth, one must first recognize that the Arizona and national economies are cyclical, with periods of strong economic gains interspersed with periods of contractions (economic recessions). The Arizona economy is substantially more cyclical than the national economy. On an aggregate basis, economic growth in Arizona is much stronger than the nation during economic expansions, but the contraction in Arizona during recessions is as deep as the national average. On a per capita basis, gains in Arizona are typically greater than the national average during expansions, but declines during recessions are larger than the national average. Comparing average economic growth over entire economic cycles is one way to adjust for these cyclical variations.
The tax reductions implemented from FYs 1979 through 1981 were possible because of strong economic growth during the late 1970s. The tax cuts did not prevent the Arizona economy from dropping into a recession, with the per capita economic decline in Arizona deeper than the national average in FYs 1981 through 1983. The tax increase that was implemented in FY 1984 did not disrupt Arizona’s economic expansion, during which Arizona experienced faster per capita growth than the national average in FYs 1984 through 1986. Despite the net tax cut between fiscal years 1979 and 1984, the economic expansion during the mid-1980s in Arizona only matched the historical norm relative to the national average.
Though a national recession did not begin until FY 1990, per capita economic gains in Arizona were atypically below the national average from FYs 1987 through 1990, as a real estate recession and federal defense spending cuts disproportionately affected the Arizona economy. To arrest the decline in general fund revenue per $1,000 of personal income that occurred during this period and to balance the budget, tax increases and spending reductions were implemented from FYs 1989 through 1992.
For the entire economic cycle from calendar year 1982 through 1991, during which the state’s tax burden was on average a little lower than it had been during the two previous economic cycles (1969 to 1975 and 1975 to 1982), annual average economic growth in Arizona relative to the national average was less than in each of the two prior cycles on each of a variety of aggregate and per person measures (see Table 2).
Economic growth in Arizona began to bounce back after FY 1992 despite the state’s tax burden being higher than during the 1980s. Before the first significant tax reductions took effect in FY 1995, the Arizona economy was growing faster than the national average. This typically faster growth in Arizona continued through the long economic expansion, but growth in Arizona did not rise relative to the national average as the significant tax cuts of the mid-1990s through 2001 took effect. As is common during economic downturns, per capita economic growth in Arizona declined during FY 2002 and was less than the national average in FY 2003 — despite historically low tax burdens.
For the entire calendar year 1991-to-2001 economic cycle, average growth in Arizona relative to the national average was less than in two of the three prior cycles based on the four aggregate measures, and was the highest by a small margin based on the two per person measures (see Table 2).
Strong economic growth returned to Arizona from fiscal years 2004 through 2007, with per capita gains greater than the national average. The growth during this period was only typical of the economic expansions of the prior cycles, despite the low tax burden and the real estate boom. Using general fund surpluses in the mid-2000s that largely can be traced to the real estate boom, another round of substantial tax cuts were implemented in FYs 2007 and 2008 that pushed Arizona’s tax burden even further below the national average. It is easily seen in Figure 5 that the tax reductions occurred after the economy had improved. In fact, the tax cuts were implemented as the economy was weakening into the deepest and longest recession since the Great Depression of the 1930s.
TABLE 2
ANNUAL AVERAGE INFLATION-ADJUSTED ECONOMIC GROWTH BY ECONOMIC CYCLE, CALENDAR YEARS 1969 THROUGH 2010
Source: Calculated from U.S. Department of Commerce, Bureau of Economic Analysis.
These tax cuts and the record low tax burden did not preclude Arizona’s economy from contracting sharply in fiscal years 2007, 2008 and 2009. Arizona’s per capita performance relative to the national average between FYs 2006 and 2010 was nearly as bad as in the late 1980s. For the entire calendar year 2001-to-2010 economic cycle, average aggregate economic growth in Arizona relative to the national average was by far the worst of the last five cycles while the per person measures were less than in three cycles and only marginally higher than in the 1982-91 cycle — despite the lowest tax burden on record.
In summary, despite the significant decline in Arizona’s tax burden relative to other states since the mid-1990s, economic growth in Arizona relative to the nation in recent years has not been stronger than the historical relationship. Thus, the empirical evidence in Arizona regarding the lack of relationship between the state’s tax cuts and subsequent economic growth matches the conceptual analysis previously discussed.
FIGURE 6
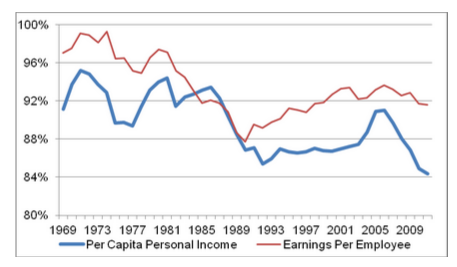
PRODUCTIVITY AND PROSPERITY IN ARIZONA AS A PERCENTAGE OF THE NATIONAL AVERAGE, CALENDAR YEARS 1969 THROUGH 2011
Source: Calculated from U.S. Department of Commerce, Bureau of Economic Analysis.
The ultimate goal of economic development is not to increase aggregate economic growth — it is to improve productivity and prosperity. Productivity in states is proxied by per employee measures; per capita measures reflect prosperity. As seen in Figure 6, Arizona’s strongest performance on these measures relative to the national average occurred in the early 1970s. Considerable declines occurred during the 1980s, starting long before the tax increases of the 1989-to-1991 period — even though tax burdens in the 1980s were a little lower than the historical norm. Some recovery in productivity occurred during the long 1990s economic expansion, but the ratio to the national average has not increased since then, remaining well below the historical level. Prosperity was flat during the 1990s, rose during the mid-2000s economic boom, but has since dropped to record low levels.
Tax Changes and State Government Tax Revenue
The improvement in government revenues when higher-than-optimal tax rates are reduced, as predicted by the Laffer Curve, comes from stronger economic growth resulting from the tax cut. Both conceptually and empirically, it has been demonstrated that changes in Arizona’s tax burden have not had any perceptible effect on Arizona’s economic performance. Thus, no positive impact on government revenues should be expected from the tax cuts implemented since FY 1993 — Arizona’s tax burden was less than the national average even when the first tax cuts were passed. Based on the Laffer Curve and the assumption that the optimal state and local government tax rate is equal to the national average, lesser tax collections should have occurred.
The declines in actual state government general fund revenues since the early 1990s are easily seen in Figure 7, which standardizes revenue over time by dividing it by personal income. The fluctuations in the line in Figure 7 reflect both changes in tax policy and the economic cycle, which has a substantial effect on government revenues, even after adjusting for personal income.
FIGURE 7
ARIZONA STATE GOVERNMENT GENERAL FUND REVENUE PER $1,000 OF PERSONAL INCOME, FISCAL YEARS 1971 THROUGH 2012
Sources: Arizona Joint Legislative Budget Committee (revenue and tax changes) and U.S. Department of Commerce, Bureau of Economic Analysis (personal income).
In the late 1970s, state general fund revenue was nearly $55 per $1,000 of personal income (alternatively, revenue was almost 5.5 percent of personal income). The tax reductions of the FY 1979-to-1981 period, combined with an economic recession, lowered that figure 17 percent by FY 1983 to less than $46. The tax increase of FY 1984 and an improving economy pushed the figure back up to around $50 in FYs 1985 and 1986, but the weakening economy caused the figure to drop in FYs 1987 and 1988. Despite further weakening of the economy, the tax increases from FYs 1989 through 1992 pushed revenues up to about $52 in FY 1991. The figure remained near $52 through FY 1995, but then fell considerably as the substantial tax reductions were implemented. In FY 2001, still a year of strong economic growth, revenue per $1,000 of personal income had declined 17 percent to below $44. It fell further in FYs 2002 and 2003 due to the economic recession, bottoming at just more than $38.
Tax revenue per $1,000 of personal income jumped during FYs 2004 through 2006 as the economy improved and capital gains soared due to the real estate boom. The peak, however,was less than $47, considerably less than the $50-55 peaks of the preceding economic cycles.
Between FYs 2006 and 2010, tax revenue per $1,000 of personal income dropped substantially (37 percent) to the lowest level on record (less than $30). The big decline largely resulted from the recession, though the tax cuts implemented from FYs 2007 through 2010 contributed.
Using the JLBC’s estimates of the effect on general fund revenue of the various tax increases and reductions implemented since FY 1989 (adjusted for inflation, population growth, and real per capita economic growth), general fund revenues that would have occurred had no tax policy changes been made also are plotted in Figure 7. Two lines are shown, one assuming that no changes had occurred since FY 1988 and one assuming that no changes had occurred since FY 1992. The latter line includes the tax increases of FYs 1989 through 1992 but excludes the tax reductions since then, since revenues from FYs 1989 through 1992 relative to personal income were comparable to those in the 1970s before the tax cuts of the FY 1979-to-1981 period.
All of the lines demonstrate the severe cyclicality of general fund revenues that has occurred since the late 1990s. The difference between the actual line and the two other lines represents the cumulative effect of the tax law changes. The cumulative effect is greatest in FY 2012: actual general fund revenue per $1,000 of personal income was more than $6 lower than it would have been had no tax changes occurred since FY 1988 and more than $13.50 lower based on no tax changes since FY 1992. At the next cyclical peak, instead of the historical norm of at least $50, revenues relative to personal income may not even reach $40.
The empirical evidence is that the effect on government revenue from tax increases and tax decreases in Arizona has been as expected based on the conceptual analysis discussed earlier: Tax increases have raised revenue and tax cuts have reduced revenue. No evidence exists of a supply-side boost in revenue resulting from the tax cuts.
Tom Rex, a fellow for the Grand Canyon Institute, has been researching Arizona’s economics, demographics, and public finance for 35 years.
Reach the author at TRex@azgci.org or contact the Grand Canyon Institute at (602) 595-1025.
The Grand Canyon Institute, a 501(c)3 nonprofit organization, is a centrist think-thank led by a bipartisan group of former state lawmakers, economists, community leaders, and academicians. The Grand Canyon Institute serves as an independent voice reflecting a pragmatic approach to addressing economic, fiscal, budgetary and taxation issues confronting Arizona.
Grand Canyon Institute
P.O. Box 1008
Phoenix, AZ 85001-1008
GrandCanyonInstitute.org
