 Charter Schools
Red Flags: Net Losses-Warning Signs in the Financial Data of Arizona’s Public Charter Schools and Recommendations for Ensuring Sustainability
March 21, 2018Red Flags: Net Losses
Warning Signs in the Financial Data of Arizona’s Public Charter Schools and Recommendations for Ensuring Sustainability
Policy Report #2 In a Financial Analysis of Twenty+ Years of Charter School Governance and Finances in Arizona
Principal Author: Curt Cardine, Fellow, Grand Canyon Institute
Co-authors Dave Wells, Research Director, Grand Canyon Institute
Amy Pedotto, Communications Manager, Grand Canyon Institute
Executive Summary
Charter schools have been authorized in Arizona since 1996. Today Arizona enrolls a greater portion of K-12 students in charter schools than any other state in the nation. In 2016-2017, the annual growth in enrollment at charters exceeded that at district schools.
Part of the proliferation of charter schools can be attributed to the minimal fiscal oversight defined by law for these private businesses. The Grand Canyon Institute’s (GCI) initial report in this series, Following the Money, noted questionable expenditures in three-quarters of charters. These transactions involved more than half a billion dollars. The recommendations in that report called for charters to be subject to state public procurement laws similar to those district schools must follow.
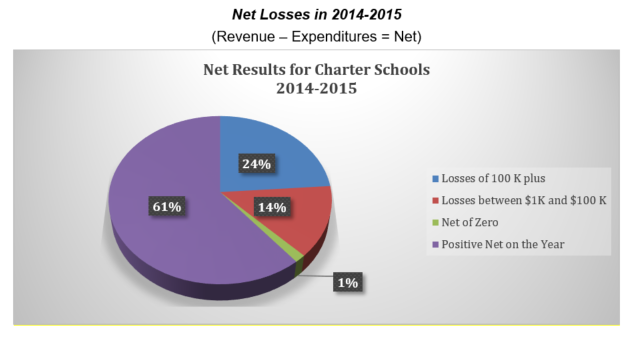
Red Flags: Net Losses is the GCI’s next policy paper reflecting on the current state of charter school governance and finances. This paper focuses on the charters that have been authorized by and report to the Arizona State Board for Charter Schools (ASBCS). Charter schools continue to open, but they also close. The data on closures shows that over 40 percent of the charter school entities authorized by ASBCS since 1994 have subsequently closed. In 2014-2015, one in four charter holders lost more than $100,000 and more than half either did not meet the financial performance expectations of the ASBCS or had cash flow problems.
In the last two months, the ASBCS has revoked or moved to revoke the charters for two multi-million dollar financially failed charters with problematic academic performance as well. In both cases, Discovery Creemos and StarShine academies, the charter holder appears to have grained tremendously financial benefits from the inability of the ASBCS to take more proactive action. In both cases, the ASBCS had previously renewed the schools’ charters for 20 years despite known problems due to limits in its statutory authority. Discovery Creemos suddenly closed on January 30, 2018. The ASBCS began an intent to revoke StarShine’s charter on March 20, 2018, after notice under Chapter 11 bankruptcy proceedings of failure to make payments and possible fraud by the United States Trustee in the Department of Justice (StarShine declared bankruptcy in February 2016).
Red Flags: Net Losses is the first of two papers detailing the financial warning signs that present themselves in charter audits, IRS 990s, and Annual Financial Reports. Where appropriate, a forensic accounting method was utilized to analyze the data.[1]
Red flags show up in the data as multiple years of net losses (expenditures exceeding revenues). A cumulative picture of a charter’s financial status is reflected in the net assets (deficits) section of the audits. This paper will purposely put this accounting language into laymen’s terms.
The two are conceptually related as schools that consistently run net losses must pull from their assets or go into deeper long-term debt in order to sustain themselves.
The recent “sudden” closure of Discovery Creemos Academy (formerly the Bradley Academy of Excellence) in the middle of the 2017 – 2018 school year and a similar closure in October of 2016 at Hillcrest Academy in Gilbert as well as the latest action by the ASBCS regarding StarShine Academy are symptomatic of the issues underlying charter financial losses and catastrophic financial failures. This paper examines some underlying causes of financial stress in the charter sector. We will show that more than one-third of charter operators have net losses and that these losses have occurred over multiple years.
In sharp contrast to the more laissez-faire charter school fiscal oversight are the strict financial checks and balances the state imposes upon districts that are in the red. Murphy Elementary School District is running a reported $2 million budget deficit, which exceeds the state-imposed revenue control limit by more than 5 percent. Consequently, the state can intervene proactively and take over the school district. While GCI is not advocating that the ASBCS take over financially troubled charters, they have no legal authority to close charters for financial reasons, which opens the door for “sudden” closures to occur.
The red flags referred to in this report were abundantly clear in financial data of Hillcrest as well as Discovery Creemos and StarShine academies in the years leading up to their financial collapse.
Charter schools that have reported negative net assets to the ASBCS range from those with questionable academic outcomes to those whose graduates are among the top in the nation. Many of these charters share red flags in their underlying financial practices that appear to be unsustainable; others might recover but should have heightened oversight.
Without more proactive oversight, deeply in debt charter schools are forced to prioritize guaranteed payments to bondholders over classroom resources. GCI recommends changes to the financial oversight of charter schools that it believes will safeguard the public’s investment in education while providing transparency regarding how tax dollars are being spent.
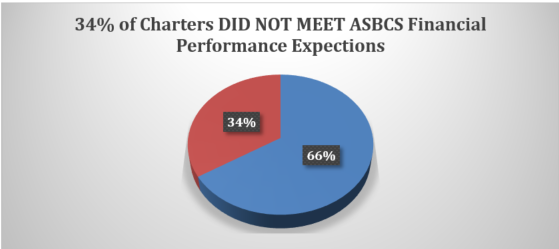
To its credit, ASBCS, the government agency responsible for governing the state’s charter schools, created a Financial Framework to guide and monitor charter school financial practices in 2012. GCI applauds this effort to define the board’s expectations regarding specific aspects of a charter school’s financials. One-third of charters currently do not meet the board’s financial performance expectations. This report goes beyond classifying the issues by probing the reasons behind the financial difficulties the board’s rating system identifies.
Currently, the ASBCS cannot close schools for financial reasons. This report does not focus on academic closures or academically failing charter schools. A charter school’s academic underperformance has consequences and the ASBCS, to its credit, has closed schools based on academic underperformance. However, our analysis of 2014 academic performance reveals that there is no causal link between academic performance or academic underperformance and financial success. Likewise, there isn’t a clear causal link between financial failures and academic performance. This seems counterintuitive because one would assume parents would be choosing schools based on academics and those schools would be thriving financially.
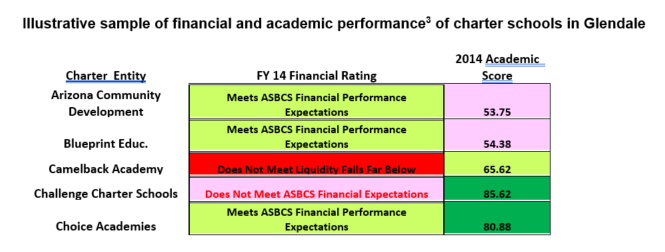
Utilizing the data from FY 2014 cases like the following illustrative sample appear consistently in the data.[2] The sample data on financial performance is posted next to the FY 2014 academic score and is illustrated below.
These Glendale charter schools show a wide range of combinations of financial performance and academic scores in FY2014.
If there is not a clear connection between an educational business’ academic and financial success, then what other factors are causing financial distress at our publicly-funded charter schools?
Average Daily Membership[4] (ADM) statistics drive the distribution of state funding to the charter industry, the primary source of revenue for charter schools. State funding shows up as revenue from the state to the charter group. How the group allocates and spends the money is defined on the expenditure side of the audits.
While ADM at charters is increasing yearly, the top ten charter groups captured almost three-quarters of the student increases. The top five of that ten capture 60 percent.
Overall, charter school ADM has grown by 29,549 from FY2014 to FY2017. Most of that gain is captured by a few large charter organizations. Most of the remaining charters have either stagnant or declining enrollment. The chart below considers the amount of ADM captured by the top 10 charter organizations (i.e. the 10 with the highest ADM growth over 4 years)
New ADM Distribution over Four Years (FY 2014 through FY 2017)
| Gain Represented by Top 10 Charter Companies | 84 Sites |
| % ADM Overall Gain to Top 10 Charter Companies: | 73% |
| ADM Numerical Gain Posted by Top Ten: | 21,703 |
| ADM Gain Shared by Remainder (417 Charter Corporations): | 7,846 |
| Total Numerical Gain of ADM FY 14 to FY 17 ALL CHARTERS | 29,549 |
Why this matters
Charter schools frequently borrow money based on projected future enrollment growth. When that ADM growth fails to occur, long-term leases and loan payments that were premised on that growth create expenditure requirements that exceed some charters’ ability to pay their debt. Long-term lease commitments are typically seen in cases where the property is held by a related-party or affiliated corporate real estate holding subsidiary of the charter.
When debt or lease payments are not based on property-value but on an anticipated income stream (from ADM growth), liabilities can exceed asset value. We believe that the charter marketplace is over-leveraged with properties that are underwater, using a term from the last mortgage crisis. In this case, underwater means the property is not worth the amount owed on the debt and the charter’s ADM is not materializing as expected. This topic will be explored in more detail in the second Red Flags report. Like the mortgage crisis in 2007 and 2008 this has been developing over a period of time. Over-leveraged bonds and loans generate negative net assets.[5] Refinancing to reduce debt payments is a short-term solution, but can be detrimental when used in the long term.
The ADM calculations and predictions that Industrial Development Authority (IDA) bonds and other financing loans are premised on for charter organizations are not being met. The financial distress caused by debt manifests as net income losses and net (deficits)[6] rather than their opposites, net income gains and positive net assets.
The statistics shown in the 2014-2015 net losses are caused by many factors several of which are addressed by this paper. The next policy paper, Red Flags: Over-Leveraged Debt, will delve into the debt and bond structures underpinning charter sector debt and property acquisition. The financial “tells” in the data (net losses and net (deficits)) are the topic of the current paper.
GCI supports a financially healthy and ethically managed charter school sector. It is a tragic loss when an academically performing innovative charter school fails financially. Emphatically stating that charters are being “run as businesses” does not excuse their management from fiscal responsibility for public funds. Charter school closures, especially those that occur during the school year, significantly disrupt the lives of students, teachers and families affected by these closures. Consequently, the ASBCS needs to be empowered to take on a stronger oversight role when charters such as Discovery Creemos Academy show signs of significant financial difficulty instead of having no power to close a school for financial reasons and ending up renewing its charter authorization for 20 years a mere seven months before it collapsed.
Market corrections, the mechanism that is theorized to correct financial issues in charter schools, are not occurring in a timely manner. GCI’s concern is that this problem could magnify without an improvement in oversight from the ASBCS.
Milton Friedman warned about this type of “business suicide” (Friedman 1999). Business suicide occurs when business owners seek out favors and exceptions from the rules that govern the use of the tax dollars that fund their businesses.
Friedman also famously noted:
“One of the great mistakes is to judge policies and programs by their intentions rather than their results.” – Milton Friedman
These papers look at the results, not the intent of the free market theories underlying the charter sector. Red flags are a clear and present danger to the charter industry and the taxpayer dollars that fund public education.
In particular, the Grand Canyon Institute recommends:
- ASBCS be given greater financial oversight power by the Legislature to put charters on probation and, if necessary, revoke charters from schools unable to meet financial improvement plans.
- ASBCS Financial Performance Dashboard be revised so as to identify charters with financial problems earlier than the current dashboard allows for and that they more closely scrutinize the financial operations of these charters.
Details on these recommendations follow.
Summary of Findings & Recommendations
The ASBCS, as a regulatory body, has the responsibility of providing oversight for the state’s charter schools. This responsibility has been evolving in an era where anti-regulation and free-marketplace beliefs have prevailed and dominated the charter economic model (theory of action).
The ASBCS, in its Financial Performance Framework and Guidance dated October 2017, states the following:
The Board, in its oversight of charter holders and the schools that they operate, strives not to be over-reaching, but also recognizes the need to protect the public’s interests. Because charter schools are public schools they must maintain the public’s trust that they are implementing their education program as set out in the charter, spending public funds responsibly, and adhering to laws and charter requirements regarding their operations. However, the Board is aware of the delicate balance between appropriate oversight and infringement on autonomy.
Based on the findings of this report, the ASBCS’ efforts—either due to limited legal authority, ideological mindsets or lack of resources—have favored charter holders over taxpayers’ interests and the state’s children. It is time that the ASBCS’ mandate and its ability to proactively oversee charter schools be revisited and strengthened.
- Finding: Average Daily Membership predictions are not being met at the majority of charters.
Change in ADM from FY2014 to FY2017
| Gained at least >0.5% ADM | Zero or Lost ADM (<0.5% ADM Change in ADM) |
| 187 Charter Entities | 240 Charter Entities |
| 44% | 56% |
- ASBCS currently can only not renew a charter OR renew it for 20 years, nothing in between.
- Charter schools commonly use Educational Revenue Bonds through Industrial Development Authorities to finance debt that is premised upon obtaining new students (ADM). These bonds are marketed and rated (normal bond or junk bonds) with greater weight placed on the charter’s projected ADM counts and less weight placed on the existing property value of the charter school. This topic is further explored in the next Red Flags
- New ADM Distribution over Four Years (FY 14 through FY 17)
| Gain Represented by Top 10 Charter Companies | At 84 Sites |
| % Gain to Top 10 Charter Companies | 73% |
| ADM Gain Posted by Top Ten | 21,703 |
| ADM Gain Shared by Remainder (417 Charter Corporations) | 7,846 |
| Total Gain of ADM FY 14 to FY 17 ALL CHARTERS | 29,549 |
University sanctioned charters gained 2,414 ADM during this time frame. Which means the remaining charters (outside of the top 10) actually shared a gain of 5,432 ADM.
Recommendation: The Arizona Legislature must grant the ASBCS the authority to place charter holders on financial probation as well as to close them if charter holders do not effectively implement a financial improvement plan within a specified period of time.
- Finding: About 4 in 10 charter holders are showing signs of financial distress—either suffering net losses or otherwise not meeting the financial performance expectations of the ASBCS. However, often it takes two to three years of substandard financial performances to have a ‘Does Not Meet’ rating from the ASBCS. The ASBCS does not currently closely examine the financial transactions of these charters, including transactions with related-party or affiliated subsidiaries that operate outside public procurement requirements.
Recommendation: The ASBCS should perform annual financial performance expectation reports rather than the current practice of grading charter organizations based on two years of financial data.
- That a charter entity which ‘Does Not Meet’ the ASBCS Financial Performance Dashboard Expectations receive a thorough review of the underlying financial decisions behind those weaknesses identified in the Financial Performance Expectations. This would require an in-depth review of the charter organization’s audit and supporting financial records as well as possible inconsistencies in related financial documents associated with the charter, i.e. IRS 990s and Annual Financial Reports submitted to the Arizona Dept. of Education. ASBCS should bring any concerns and recommendations to the attention of the charter holder.
- That any charter entity that has negative net income and/or net asset (deficits)be required to submit the audits of any related-party or otherwise affiliated subsidiaries dealing with that charter that operates outside a public procurement process. The current system allows these companies, whose sole source of income comes from taxpayer funding via the charter school they conduct business with, to operate without financial oversight from the ASBCS and the public.
- That charter school audits be required to include details on revenue and expenditures rather than gross accounting for the Charter Program and Management and Other.
- That charter organizations that show negative net income and/or net asset (deficits) for consecutive years be placed on financial probation and be required to submit an action plan for correcting the deficits. Continuation of the charter organization’s charter should be determined at an ASBCS board meeting after operating for two years on financial probation and a thorough review of the plan’s efficacy.
- Finding: Red flags emerge in the financials for charter schools well before they fail financially. Failure to intervene allows debt to increase, leading to greater risk to investors and resources being diverted from the classroom to bondholders.
Recommendation: The ASBCS Financial Performance Dashboard currently has no “falls far below” criteria for its three sustainability measures. GCI recommends that two “falls far below” criteria be developed for these sustainability measures.
- The ASBCS should replace the Fixed Charge Coverage Ratio (FCCR) with the Debt Service Coverage Ratio (DSCR).[7] The FCCR measures how much net income a business has relative to what it needs to cover debt payments and obligations, but does not make exceptions for one-time costs or (noncash) depreciation. Because net income is also tracked and includes these costs, DSCR, which excludes these, is a better overall measure of the long-term ability of a charter holder to service debt. Industrial Development Authority (IDA) charter bonds typically have a DSCR requirement, but make no mention of a FCCR.
- If the FCCR is used, the current 1.10 ASBCS standard is appropriate. However, if the FCCR falls below 1.0, then the business must rely on cash reserves or maneuvers that delay debt payments in order to meet this obligation or simply take on more debt. Hence, falling below 1.0 should be classified as ‘Falls Far Below.’
- If the DSCR is used, charter IDA bonding agreements typically require a minimum ratio of 1.15 (DSCR will be equal larger than the FCCR). That should be the standard. Falling below 1.0 is considered a sign of likely default and should be the “Falls Far Below” standard.
- Net income. Net income is related to net assets, as when net income is negative (a net (deficit)) it reduces the firm’s net assets. The ASBCS currently has a standard that if net income is negative then the charter school ‘Does Not Meet’ the standard, but does not define a standard for ‘Falls Far Below.’ Since the ASBCS has no formal criteria regarding net assets, GCI recommends that if net income and net assets are negative that the charter holder be deemed as ‘Falls Far Below’ the standard. Alternatively, if net income is negative and 5 percent or more of expenses, it should also be noted as ‘Falls Far Below’, as normally negative net income greater than 3 percent of expenses is the threshold for serious cause for concern. Likewise, 5 percent parallels the 5 percent threshold for state takeovers of district schools.
- Finding: Raising standards of financial accountability need to be enforced in order to be impactful.
Recommendation: The Arizona Legislature should allocate adequate resources to the ASBCS so that it can fulfill its obligations as the regulatory body overseeing the majority of the state’s charter schools and ensure that it is sufficiently staffed to meet the technical tracking needed to effectively meet the recommendations in this report.
[1] Forensic accounting involves a more in-depth look beyond numbers directly presented to analyze basis, consistency and comparisons.
[2] The full list of FY2014 financial performance and academic scores is available at https://grandcanyoninstitute.org/wp-content/uploads/2018/03/AZ-Charters-Academic_and_Financial_for_2014.xlsx.
[3] Color coding in both frameworks is consistent. The colors move from Green to Red. On the academic side a 100 is a perfect score. The Challenge Charter School with a pink ‘Does Not Meet’ in the financial area has a dark green in the academic area, which is the highest range. Great academics do not ensure great financials.
[4] ADM which stands for Average Daily Membership is represented with up to three decimal point calculations. It is the number of days ACTUALLY attended by students at the school. Example: If a student misses six days due to illness the ADM is drawn down by 6 for that student. Kindergarten is reimbursed at 0.5 in the ADM calculation. SPECIAL EDUCATION figures are weighted ADM numbers, which increases the funding for those students so identified.
[5] Negative net assets are written as net (deficits) on financial statements with a bracket to indicate the negative amount. This paper uses this convention and red coloring when there are net (deficits) indicated.
[6] The term ‘net losses’ will refer to ‘revenues’ that do not equal the company’s expenses. ‘Net assets’ indicates positive net assets. ‘Net (deficits)’ indicates the company has a deficit (i.e. their net assets are in the red.)
[7] The Fixed Charge Coverage Ratio (FCCR) = (Net Income excluding interest + Fixed Charges)/(Fixed Charges + Interest). Fixed Charges are expenses that do not vary based on the number of students in a charter context such as insurance and lease/property costs. Net income is the overall profit or loss of the operation. An FCCR of 1 means a charter has just enough overall income to meet its debt and interest payments. The Debt Service Coverage Ratio (DSCR)=(Net Income excluding debt payments + noncash expenses like depreciation + one-time charges not paid in cash)/(interest and principle payments). The DSCR focuses on items paid for in cash. So Net income gets to add back depreciation and is divided by the debt payment. A DSCR of 1 means you have just enough cash to make your debt payment. For example, take a charter with round numbers and rough categorization. Net Income=$700,000. Fixed Charges (management fees, insurance, legal, accounting, occupancy)=$6,500,000. Interest=$2,200,000. FCCR= ($700,000+2,200,000+$6,500,000)/($6,500,000+$2,200,000)=1.08. To calculate DSCR, include depreciation=$250,000. Debt amortization (principle)=$200,000. Noncash loss on disposal of assets=$50,000. DSCR=($700,000+$2,200,000+$200,000+$250,000+$50,000)/($2,200,000+$200,000)=1.42. As this example illustrates, the DSCR will always be greater than the FCCR because it excludes noncash expenses. In this case 1.42 compared to 1.08.