 Budget
A Fiscal Analysis of Proposition 123 and Arizona’s Underinvestment in K-12 Education: an essential first step for K-12 funding
January 7, 2016A Fiscal Analysis of Proposition 123 and Arizona’s Underinvestment in K-12 Education:
an essential first step for K-12 funding
By Dave Wells, Ph.D.
Research Director, Grand Canyon Institute
Executive Summary
Under Prop. 301 passed by voters in 2000, the legislature was obliged to adjust per student base level funding for K-12 by the change in the GDP deflator or 2 percent, whichever was less. However, beginning in FY2010 and continuing through FY2013 it was instead frozen, leading to the Cave Creek v. Arizona lawsuit. In September 2013, the State Supreme Court sided with the plaintiffs and remanded the case back to the trial court to determine the appropriate remedy. Since the Supreme Court hadn’t fully defined what was owed to public schools that became the focus of the litigation.
Negotiations between the two sides reached an impasse in August 2015, but after the Governor’s office subsequently intervened by the end of October with lightning speed a proposed financial settlement in Cave Creek v. Arizona was made public Tuesday, Oct. 27, the legislature was called into Special Session on Wednesday, Oct. 28 and by Friday, Oct. 30, the settlement and a plan to fund it had passed both chambers and been signed by the Governor, giving virtually no time for public scrutiny. A May 17, 2016 special election on Proposition 123 will determine the final outcome.
The settlement, therefore, focuses around what public schools were owed under Prop. 301. A separate, but important issue, is addressing Arizona’s underinvestment in K-12 education. Of all the states, Arizona arguably has the worst K-12 funding record over the past two decades. Funding Prop. 301’s legal minimums is only a small part of that larger issue.
This proposal does provide a significant immediate increase of $300 million in educational funding, largely taken from the State Land Trust Fund. The proposal also gives the legislature more flexibility in funding K-12 education during fiscal downturns.
The proposal, however, does not represent new money into K-12 education. It should be viewed in terms of getting the state back to a legal minimum in funding K-12 education, while redefining that minimum in a more flexible manner to reduce the likelihood of a similar lawsuit. Nonetheless, Prop. 123, which implements the settlement, is an essential first step in addressing the state’s underinvestment in K-12 education.
Key findings include:
• The settlement funds 72 percent of the lost base level increase that was the subject of the lawsuit.
• The settlement provides half of the back payments that could have been owed public schools.
• The inflation adjustment is modified so that automatic inflation adjustments to educational base funding in the future will no longer automatically occur during times of economic distress. GCI expects at least one recession between 2015 and 2025, consequently,
o Rather than the $3.5 billion increase over ten years above base level funding that Gov. Ducey has promoted, the result will be closer to $3.3 billion
• While enhancing the payment from the state land trust fund, officially called the Permanent Land Endowment Trust Funds (PLETF) to 6.9 percent would not be appropriate permanently, it’s reasonable policy for ten years since the normal 2.5 percent flat disbursement rate is below the typical real rate of return on its assets.
• The 49 and 50 percent discretionary triggers on the General Fund expenditures to the Arizona Department of Education, which enable base level funding to be frozen or reduced, respectively, should have been tied to an economic trigger in the unlikely event it is reached.
• The settlement was not designed to address the broader issues of education funding. Simply returning to FY2007 levels will by FY2026 require more than $2 billion in annual funding beyond Proposition 123’s proposals.
o The 0.6 percent education sales tax is set to expire after F2021 creating an additional $800M funding gap that has not been dealt with.
o $1 Billion has been cut from K-12 from new construction, building repairs, soft capital and all-day Kindergarten.
o After 2025 when disbursements from the PLETF fall back to 2.5 percent annually, there will be a $200 funding gap for the General Fund to take on.
o Inflation-adjustments are not sufficient K-12 investments. On an inflation-adjusted basis, Arizona’s state-based investments in K-12 education have diminished from 20 years ago. Arizona arguably has the worst K-12 education funding record during that time. The settlement doesn’t significantly alter that reality, and the ramifications of diminished investment lower the quality of education in Arizona, limiting future potential economic growth.
Recommendation:
Proposition 123 resolves the Cave Creek v. Arizona lawsuit. It represents a starting point, not a concluding point, for state investment in education. It prevents what could have been years of ongoing litigation, gives school districts greater certainty when planning minimum possible budgets, and puts the state back into minimum legal levels of education funding. However, it’s insufficient to make a marked improvement in educational outcomes. A surge of one-time additional funding above inflation will occur in FY2016, if approved by voters, but to improve student achievement will require investments beyond the legal minimums of Proposition 123
Policy Paper
January 7, 2016
A Fiscal Analysis of Proposition 123 and Arizona’s Underinvestment in K-12 Education:
an essential first step for K-12 funding
By Dave Wells, Ph.D.
Research Director, Grand Canyon Institute
Executive Summary
Under Prop. 301 passed by voters in 2000, the legislature was obliged to adjust per student base level funding for K-12 by the change in the GDP deflator or 2 percent, whichever was less. However, beginning in FY2010 and continuing through FY2013 it was instead frozen, leading to the Cave Creek v. Arizona lawsuit. In September 2013, the State Supreme Court sided with the plaintiffs and remanded the case back to the trial court to determine the appropriate remedy. Since the Supreme Court hadn’t fully defined what was owed to public schools that became the focus of the litigation.
Negotiations between the two sides reached an impasse in August 2015, but after the Governor’s office subsequently intervened by the end of October with lightning speed a proposed financial settlement in Cave Creek v. Arizona was made public Tuesday, Oct. 27, the legislature was called into Special Session on Wednesday, Oct. 28 and by Friday, Oct. 30, the settlement and a plan to fund it had passed both chambers and been signed by the Governor, giving virtually no time for public scrutiny. A May 17, 2016 special election on Proposition 123 will determine the final outcome.
The settlement, therefore, focuses around what public schools were owed under Prop. 301. A separate, but important issue, is addressing Arizona’s underinvestment in K-12 education. Of all the states, Arizona arguably has the worst K-12 funding record over the past two decades. Funding Prop. 301’s legal minimums is only a small part of that larger issue.
This proposal does provide a significant immediate increase of $300 million in educational funding, largely taken from the State Land Trust Fund. The proposal also gives the legislature more flexibility in funding K-12 education during fiscal downturns.
The proposal, however, does not represent new money into K-12 education. It should be viewed in terms of getting the state back to a legal minimum in funding K-12 education, while redefining that minimum in a more flexible manner to reduce the likelihood of a similar lawsuit. Nonetheless, Prop. 123, which implements the settlement, is an essential first step in addressing the state’s underinvestment in K-12 education.
Key findings include:
• The settlement funds 72 percent of the lost base level increase that was the subject of the lawsuit.
• The settlement provides half of the back payments that could have been owed public schools.
• The inflation adjustment is modified so that automatic inflation adjustments to educational base funding in the future will no longer automatically occur during times of economic distress. GCI expects at least one recession between 2015 and 2025, consequently,
o Rather than the $3.5 billion increase over ten years above base level funding that Gov. Ducey has promoted, the result will be closer to $3.3 billion
• While enhancing the payment from the state land trust fund, officially called the Permanent Land Endowment Trust Funds (PLETF) to 6.9 percent would not be appropriate permanently, it’s reasonable policy for ten years since the normal 2.5 percent flat disbursement rate is below the typical real rate of return on its assets.
• The 49 and 50 percent discretionary triggers on the General Fund expenditures to the Arizona Department of Education, which enable base level funding to be frozen or reduced, respectively, should have been tied to an economic trigger in the unlikely event it is reached.
• The settlement was not designed to address the broader issues of education funding. Simply returning to FY2007 levels will by FY2026 require more than $2 billion in annual funding beyond Proposition 123’s proposals.
o The 0.6 percent education sales tax is set to expire after F2021 creating an additional $800M funding gap that has not been dealt with.
o $1 Billion has been cut from K-12 from new construction, building repairs, soft capital and all-day Kindergarten.
o After 2025 when disbursements from the PLETF fall back to 2.5 percent annually, there will be a $200 funding gap for the General Fund to take on.
o Inflation-adjustments are not sufficient K-12 investments. On an inflation-adjusted basis, Arizona’s state-based investments in K-12 education have diminished from 20 years ago. Arizona arguably has the worst K-12 education funding record during that time. The settlement doesn’t significantly alter that reality, and the ramifications of diminished investment lower the quality of education in Arizona, limiting future potential economic growth.
Recommendation:
Proposition 123 resolves the Cave Creek v. Arizona lawsuit. It represents a starting point, not a concluding point, for state investment in education. It prevents what could have been years of ongoing litigation, gives school districts greater certainty when planning minimum possible budgets, and puts the state back into minimum legal levels of education funding. However, it’s insufficient to make a marked improvement in educational outcomes. A surge of one-time additional funding above inflation will occur in FY2016, if approved by voters, but to improve student achievement will require investments beyond the legal minimums of Proposition 123.
Key Findings and Recommendations in More Depth
The settlement funds 72 percent of the lost base level increase and half of the back payments that could have been owed public schools.
The proposal raises base funding per student count from the $3,426.74 to $3,600, but not $3,666.84 which would have put the state in full legal compliance, so the new funding to students for 2015-2016 is 72 percent of what without the settlement would have been legally owed.
In addition, failures to fully fund base levels from 2009-2010 through 2012-2013 had led to potential back payments of $1.263 billion dollars. Under the settlement, that is cut in half to $625 million paid out without any adjustment for inflation over ten years.
The inflation adjustment is modified so that automatic inflation adjustments to educational base funding in the future will no longer automatically occur during times of economic distress. GCI expects at least one recession between 2015 and 2025; consequently,
• Rather than the $3.5 billion increase over ten years above base level funding that Gov. Ducey has promoted, the result will be closer to $3.3 billion.
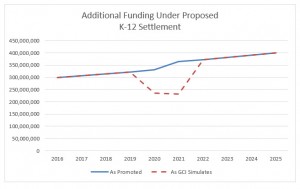
The settlement also includes language that if approved by voters that will give the legislature greater control in the future regarding whether or not an inflation adjustment is made to the base level during times of economic distress. Recessions occurred in 2001 and 2008-2009, both had significant financial ramifications for the state, especially the latter one. The triggers that allow the legislature to avoid the automatic inflation adjustment will assist budgeting during tight fiscal times. However, potential freezes on inflation adjustments will not change the baseline of subsequent adjustments. This trigger will effectively prevent a future lawsuit over this issue. Figure 1 contrasts what has been promoted and GCI’s simulated estimate for 2016-2025.
Figure 1
While enhancing the payment from the state land trust fund, officially called the Permanent Land Endowment Trust Funds (PLETF) to 6.9 percent would not be appropriate permanently, it’s reasonable policy for ten years since the normal 2.5 percent flat disbursement rate is below the typical real rate of return on its assets.
The value of the PLETF depends on land sales and royalties as well as the returns on investments. The PLETF did not really begin to appreciate in value until 1999 when after voter approval it began to invest in stocks for up to 60 percent of its assets. Figure 2 is reproduced from a recent Morrison Institute and W.P. Carey School of Business affiliated authors report, “State Trust Lands and Education Funding,” and illustrates how the introduction of equities, which Congress allowed back in 1957, has led to a substantial growth in the value of the PLETF. This growth was also in part due to greatly enhanced land sales during the real estate market boom/bubble that ended in 2008 (see Figure 9).
The corpus of the fund would generally be defined as the proceeds from the sales and royalties from state trust lands adjusted for inflation. The prior trust fund distribution formula focused on those returns above inflation, so it consistently preserved the corpus. However, the dramatic decline of the stock market in late 2008 led to zero real growth and, no distributions at a time the state could most use it. As a result, voters were asked to approve in 2012 a 2.5 percent flat distribution rate. The current 2.5 percent flat rate distribution tends to distribute a lesser amount than the real return, creating space during fiscal emergencies to take a larger amount from the fund.
The Joint Legislative Budget Committee found over the past 15 years the assets in the PLETF averaged a 6.33 annual return. During that time period, as measured by the GDP price deflator, inflation averaged 2.29 percent, which means the typical real return on assets was 4.04 percent. This means a 4 percent rate of disbursement from the trust fund would be sustainable over the long-term. Technically it could be as high as about 4.6 percent without reducing the real value of the PLETF, since the disbursements are based on the average of the last five years’ value of the PLETF, not its current market value.
The Grand Canyon Institute adopts the JLBC’s assumed rate of return in its estimates. The 6.9 percent annual take for ten years under Prop. 123 clearly exceeds 4.6 percent, the amount that long-term can be sustainably be taken from the State Trust Fund. However, as it is bounded by 2.5 percent flat rates before and after, this impact is effectively mitigated, since 2.5 percent is below the typical real return on assets.
Triggers in the proposal tied to if the five year average value falls below the 6-10 year value of the PLETF make it fairly unlikely that the nominal value of the trust fund would go down during the ten years, especially since new land sales are added to the return on assets, but if those triggers are activated the corpus will be preserved and no other source would replace it for K-12 funding.
Figure 2
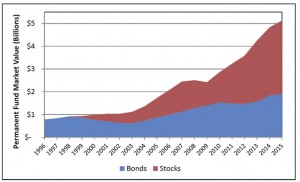
Impact of Stock Investments and Growth of Land Sales on Market Value of Permanent Fund
Source: Artigue, Gammage, Hunting and Stapp (2015)
What’s less advised is using the 6.9 percent enhanced proceeds from the PLETF to meet the ongoing legal minimum requirements of K-12 funding. Enhanced payouts from the PLETF could be used for the $625 million in one-time payments and re-setting the base level to $3,600 for FY2016. To do that would require a 4 percent as opposed to a 6.9 percent distribution rate over the ten years. However, then the amount coming from the General Fund would rise substantially.
That the proposal relies on a 6.9 percent funding mechanism speaks to the fiscal weakness of the state. This is largely due to excessive tax cuts, totaling $4 billion since 1993 and $1 billion since 2007 (see Tables 8 and 9 for details), which have failed to create higher per capita income and revenue growth as promised, and instead make it very difficult for the General Fund to meet even its most basic obligations.
Two point five percent may be too low of an ongoing payment to K-12 education from the PLETF and 6.9 percent is too high to be done permanently, but, regardless, these payments should be over and above the inflation adjusted minimum base level, not essential elements of it.
The 49 and 50 percent discretionary triggers on the General Fund expenditures to the Arizona Department of Education, which enable base level funding to be frozen or reduced, respectively, should have been tied to an economic trigger in the unlikely event it is reached.
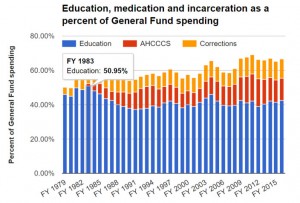
The Arizona Capitol Times found we’d need to go back to 1983 during the rollout of a new K-12 funding formula to find a time when Dept. of Education spending exceeded 50 percent, which under Prop. 123 would enable the legislature to cut the base funding amount by up to twice the inflation adjustment. The only other time it exceeded 49 percent, when Prop. 123 would allow the legislature to waive the inflation adjustment for K-12 education was two years before that in 1981. This period was before the state’s Medicaid program, AHCCCS, had been fully implemented. Figure 3 is reproduced from the Arizona Capitol Times to illustrate this . So the likelihood of exceeding this threshold seems slim, yet the proposal now gives this threshold, if passed, “voter approved status,” making tinkering with it nearly impossible short of going back to voters. Reportedly legislative leaders were concerned about a major economic downturn depressing state revenues so much that the 49 percent threshold might be reached. Yet oddly unlike the inflation adjustment triggers, this threshold has no economic trigger, such as both employment growth and sales tax increases both being below 2 percent. Consequently, the most likely ways in which it would be surpassed would be by proposals to administratively re-organize education funding or an initiative that substantially increased K-12 appropriations. Alternatively, continued tax cuts combined with a restriction on Medicaid coverage could also push Department of Education funding proportionately upward.
Current appropriations to the Department of Education represent 42 percent of the General Fund that has been relatively stable, but it also doesn’t include the 0.6 percent education sales tax or monies that have gone to the School Facilities Board. If all monies going to K-12 education were to become part of the General Fund or the School Facilities Board fell under ADE, or the legislature continued to reduce revenues through tax cuts, the probability of ADE hitting the 49 percent cap increases. Consequently, this language may have the unintentional impact of curtailing discussions about re-organizing the administration of education funding.
Figure 3
Source: Arizona Capitol Times
The settlement was not designed to address the broader issues of education funding. Simply returning to FY2007 levels will by FY2026 require more than $2 billion in annual funding beyond Proposition 123.
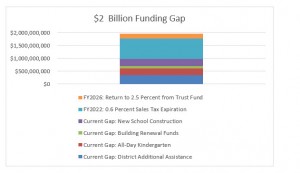
FY 2007 was a peak year for recent education funding, so is a benchmark to measure the degree to which the proposed settlement returns us to that level. Areas outside the inflation adjusted base level include money for computers and textbooks formerly known as Soft Capital and now called District Additional Assistance. Following the Roosevelt v. Bishop Case, the state also took on more responsibility for school repairs and construction. Finally, Governor Napolitano was successful in getting funding for all-day Kindergarten included. That was rescinded when stimulus money ran out, despite a temporary sales tax, and the state returned to funding only a half-day of Kindergarten. Collectively adjusting each of these areas from their peak amount and then 1.6 percent annually for inflation, they total nearly $1 billion in additional K-12 cuts, as detailed below. While there are many smaller areas that have seen funding changes, these are four major reductions.
• Soft Capital and Capital Overlay now known as District Additional Assistance: $352 million
• All day Kindergarten: $247 million (also adjusted for enrollment growth)
• Building Renewal Funds: $93 million (based on actual 2007 allocation-not formula)
• New School Construction: $288 million.
There is an additional future $1 Billion Funding Gap
• The 0.6 percent education sales tax is set to expire after FY2021 creating an additional $800M funding gap that has not been dealt with.
• After FY2025, when state trust land disbursements return to 2.5 percent, there will be a $200 M funding gap that will need to be covered by the General Fund.
Figure 4
Under Governor Hull’s leadership, the legislature referred Prop. 301 in 2000 that was passed by voters. It not only had the inflation adjustment to the base level provision that led to the lawsuit, but it also included a twenty-year 0.6 percent sales tax for education. That tax will expire after FY2021, leaving an $800 M funding hole. In addition, when the amount taken from State Land Trust returns to 2.5 percent, there will be a $200 million funding gap that would fall on the General Fund.
Thus, there is an additional $2 billion total gap in funding, even if Proposition 123 passes.
• Inflation-adjustments are not sufficient K-12 investments. On an inflation-adjusted basis, Arizona’s state-based investments in K-12 education have diminished from 20 years ago. Arizona arguably has the worst K-12 education funding record during that time. The settlement doesn’t significantly alter that reality, and the ramifications of diminished investment lower the quality of education in Arizona, limiting future potential economic growth.
It may come as shock to learn that at one time Arizona was not at the bottom of K-12 expenditure. Up until 1980, Arizona provided a state minimum amount of funding and allowed local school boards to increase upon that as they wished in the form of local property taxes. Arizona ranked 28th in its K-12 expenditures, but the result was highly inequitable with richer school districts able to spend far more than poorer ones. The state general fund typically spent less than 40 percent on K-12 education. In 1980 the funding formula adopted, essentially in place today, allowed the state legislature to set spending limits and gave limited and highly regulated authority to local jurisdictions to raise spending beyond the state limit.
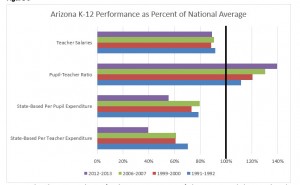
In the 1980s, the state’s adoption of Medicaid (see Figure 3) completed with K-12 education spending and staring in the mid-1990s a series of major tax cuts were put in place that significantly compromised the ability of the state to fund education. That pressure was somewhat relieved with the 0.6% education sales tax authorized by voters in 2000 and the economic expansion and real estate bubble that occurred in the early 2000s. However, Figure 5 shows that even with these measures the state only held its own compared to other states, slightly raising teacher salaries but allowing the pupil-teacher ratio to continue to creep upwards.
Figure 5
Sources: Selected years National Center for Education Statistics, Digest of Education Statistics (Salaries, Pupil Ratio) and Census Bureau Pubic School Finances (state-based financing). Per Teacher Expenditure derived from Pupil-Teacher ratio and state-based financing.
The major cutbacks in state-based funding since 2007 for K-12 education relative to other states can be seen in the decline of teacher salaries, the huge increase in pupil-teacher ratios (larger class sizes), and the state plummeted to 50th in state-sourced revenue for K-12 education. In 1991-1992, the state ranked 39th, in 1999-2000 had dropped to 46th, and the passage of Prop. 301 and higher state revenues enabled Arizona to climb back to 41st by 2006-2007. However, by 2012-2013 Arizona was last.
The impact is even more dramatically seen if instead of looking at per pupil expenditures that are state-sourced, one considers per teacher expenditures that are state sourced. Here the combination of lower per pupil spending combined with a ratcheting upward pupil-teacher ratio yields the most shocking result of all, state-sourced per teacher funding has plummeted from 70% of the national average in 1991-1991 to 60% in both 1999-2000 and 2006-2007 to a worst in the nation, only 40% of the national average in 2012-2013.
Not surprisingly, as the Arizona Department of Education’s Educator Recruitment and Retention report from January 2015 noted, retention rates of teachers in Arizona are low with teachers frequently leaving for better paying jobs outside education or to states that offer smaller classes and/or better compensation. Consequently, about a thousand teaching positions were still open as school was getting near beginning—many were filled by substitutes. The New York Times reported last year that a recent Arizona teacher of the year had not received a pay raise since he was hired in 2008.
Figure 6
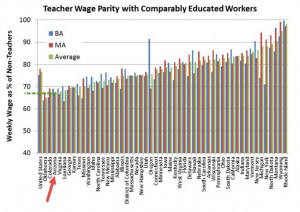
Source: Data from Economic Policy Institute, “The Teaching Penalty: An Update through 2010,” graphic edited from one presented by Baker, School Finance Blog, “SB24 won’t solve CT’s real Teacher Equity Problems,” https://schoolfinance101.wordpress.com/2012/03/26/sb24-wont-solve-cts-real-teacher-equity-problems/
Figure 6 using data from a 2011 Economic Policy Institute study shows for 2010 how teaching salaries (benefits are excluded) are worse than comparable jobs with similar educational requirements—and that compared to other states Arizona’s teachers are at a larger pay disadvantage.
Figure 6 overstates the gap, as it does not include benefits. Benefits are stronger in the public sector. GCI’s 2012 research report, “Are Arizona Pubic Employees Over Compensated?” found that inclusion of total compensation instead of salary only reduced the gap by approximately 9 percent.
What Figure 6 suggests is what’s occurring, that teaching positions will become harder to fill, more so in Arizona than elsewhere. However, school districts are limited in what they can do as the legislature sets the limit on education spending and budget overrides if approved by voters, are also limited. Consequently, we see an overall strategy to try and maintain pay, but allow higher class size in an effort to try and stay more competitive. One should also note Arizona has very low administrative costs compared to other states as well.
Bottom Line: Proposition 123 is an essential first step, but Arizona needs to do much more with K-12 School Funding
The $3.3 billion in added funding isn’t added at all. Except for the $625 million in one-time money over ten years, there are no new real dollars. Economists make a distinction between real inflation-adjusted dollars and nominal dollars that are not adjusted for inflation. If you’re offered $100 now or $100 ten years from now, you’d take the former, because $100 is worth more now than in the future. When policy discussion get focused only on nominal dollars, you can lose the forest from the trees.
Prop. 301 caps the inflation adjustment at 2 percent. That means presently we only partially adjust for inflation. Yet education like many productivity increasing services typically needs to increase far more than the inflation level to maintain effectiveness. Consequently, focusing only on inflation adjustments misses the larger picture.
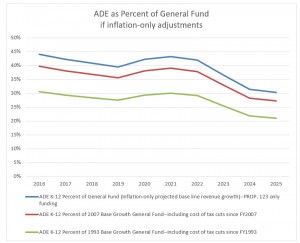
Economic growth is what occurs after inflation and population growth are accounted for. So keeping K-12 funding at a constant level in the General Fund means increasing K-12 expenditures above this base line. The base line is a fallback limit, not the target for K-12 spending. In Figure 8, we have projected the baseline growth of the General Fund through 2025 based on the base line growth of the years used to simulate the future. As you can see in on adjusting for inflation as done through Prop. 123 leads to K-12 being a smaller part of the General Fund.
Figure 7
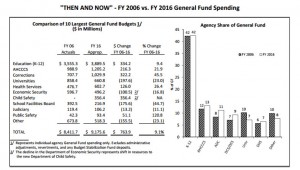
Source: Joint Legislative Budget Committee
In Figure 7 from the JLBC, you can see that K-12 spending over the last ten years as a portion of the General Fund has been relatively constant. This has occurred because revenue gains have been quite flat due to two reasons. One, the massive economic downturn that hit Arizona particularly hard in 2008 has taken years to recover from. Even now Arizona’s economy has not recovered with the level of population and employment growth that we’ve enjoyed in the past. But revenues to the General Fund have also lagged for another significant reason, reducing the tax base through tax cuts. Tax cuts do have a cost, especially when they don’t bring the economic growth that politicians frequently express when they are passed. Since FY2007, the legislature has reduced revenues by $1 billion (see Table 9). So when you combine anemic growth with aggressively reducing the tax base, then K-12 expenditures can stagnate and stay at the same percent of the General Fund.
Since 1993, the legislature has reduced the tax base by $4 billion dollars, meaning the General Fund without those tax changes would exceed $13 billion, and K-12 spending today represents about 30 percent of that amount, instead of 42 percent. That trail of tax cuts explains why the projected base line growth of the General Fund may not occur and K-12 spending might in fact be a higher percentage of General Fund. While the settlement proposal improves the minimum expenditure for K-12, this is not a significant change in K-12 investment.
Figure 8
Using the base revenue growth, if no tax additional tax cuts were to take place, Figure 8 illustrates that providing an inflation-only adjustment rather than move toward 49 percent, K-12 expenditures plummet toward 30 percent. For comparison the General Fund base level growth in lieu of tax cuts since 2007 and 1993 are also included.
Background and Calculations
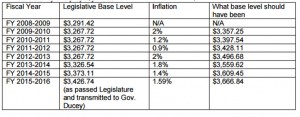
The Cave Creek v. Arizona lawsuit sprung from the state legislature choosing to apply the inflation indexing of Prop. 301 only to transportation and not to base level funding. Table 1 illustrates the actual base funding levels and those set by statute.
Table 1: State Failure to Fully Fund Base Level Inflation Factor
Source: Arizona Education Association, http://www.arizonaea.org/assets/document/AZ/AEAK12BudgetSummary2015.pdf
Table 2 illustrates what plaintiffs argued the state owed. Part of this was re-setting the base level to the appropriate amount and the other was back payments to cover prior years where schools were illegally underfunded. The state legislature claimed due to years in the 2000s where the legislature increased funding by more than inflation that they only owed $74 million to reach a minim base level if the legislature had only funded the inflation increase.
That position was legally dubious, since the court based on the case so far was likely to find that the intention of the proposition was to create a floor for education base line funding and make sure it was at least increased by the inflation factor, not that it could be later cut to a lower level. Consequently, plaintiffs were arguing the state needed to increase the current base level to the appropriate amount, which would cost more than $300 million each year. In addition, FY2009-2014 were systematically underfunded, and the plaintiffs have said the state should pay that back part over five years, which the JLBC calculated as $252 million per year.
Table 2: K-12 Education Funding Lawsuit Financial Implications
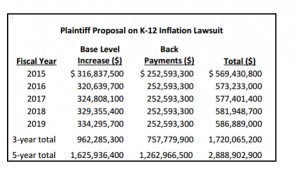
Source: Joint Legislative Budget Committee, “K-12 Funding Lawsuit,” January 24, 2014, http://www.azleg.gov/jlbc/K-12InflationFundingLawsuit.pdf
Both sides had an interest in settling, so that monies due schools would come to them sooner for plaintiffs and so lawmakers could plan with greater fiscal certainty without a court decision looming. Negotiations between the sides reached an impasse in August, but continued, and with the intervention of Governor Ducey a settlement was announced on Tuesday, Oct. 27. The proposed settlement raises base funding levels to $3,600 or an increase of 72 percent of the full adjustment that the legislature was legally liable for.
Table 3: Proposed Funding Settlement –Assuming 1.6% annual inflation and 1.4% student growth.
Source: Joint Legislative Budget Committee
The issue of back payments was more challenging in terms of how much the court would order. Most likely the state would at least have been held liable for payments since the Supreme Court decision in September 26, 2013 (early in FY 2014) in the plaintiff’s favor. The settlement provides half the back payments that plaintiff’s sought of $625 million paid over ten years.
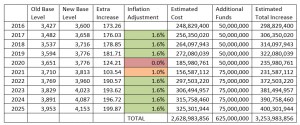
The funds going to K-12 education under the settlement proposal are shown in
Table 3: Proposed Funding Settlement –Assuming 1.6% annual inflation and 1.4% student growth.
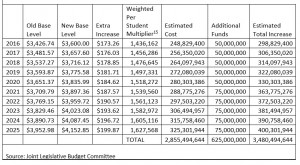
Table 4: Illustration of Inflation Triggers if in place 1999-2015
Year Employment Growth June to June TPT (Sales Tax) Growth Inflation adjustment (under settlement)
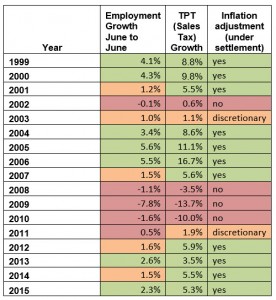
Table 3 ignores that under the proposal the annual inflation increases could not occur or be discretionary. The settlement puts a trigger on inflation adjustments using annual nonfarm employment growth and sales tax revenue growth. If both are less than 2 percent, but at least one exceeds 1 percent, then the legislature can lower or eliminate the inflation adjustment, and if both are less than 1 percent, then there can be no inflation adjustment. The proposal would follow the calendar year with a February 1 reporting date to the legislature. Because TPT data has been collected over fiscal years, Table 4 looks at the data instead over Fiscal Years. Looking at the period from 1999-2015 as shown in Table 4, one can see that of the 17 years covered, an automatic inflation adjustment occurs 11 times, two times it would have been at the legislature’s discretion and four times it would have been disallowed. This provision would likely eliminate future lawsuits based on the inflation adjustment. It’s important to note that denied or lowered inflation adjustments only delay the adjustment. Any amount not fully paid would become immediately added to the base level as soon as at least one of the triggers exceeded 2 percent, which would normally be TPT (sales tax) growth.
With Table 4 in mind, we revisit Table 3 and simulate future economic growth by applying the employment and TPT (sales tax) growth results from 2012-2013 and 2001-2007 for 2017-2025 as shown in Table 6. In Table 5 the Old Base Level is adjusted by 1.6 percent each year as we presume would occur under current law. However, the new base level is subject to the trigger. This analysis presumes that when employment growth and sales tax (TPT, transaction privilege tax) growth are both less than 2 percent, but one or both are at least 1 percent, that the legislature increases education funding by 1 percent. In reality the legislature could provide anywhere from no increase to a full inflation adjustment. If both are less than 1 percent then the legislature would not provide an inflation adjustment. The legislature in other years could provide more than the full inflation adjustment. However, given the current fiscal situation, GCI presumes that a full inflation adjustment is the upper bound or that added monies would be forthcoming regardless of what the base level of funding was.
Table 5: 2017-2025 Simulated Economic Performance (based on prior actual activity in Arizona)
Employment
Growth TPT Growth Inflation adjustment
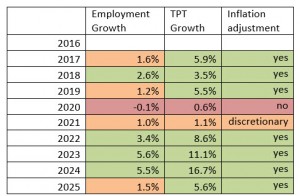
Table 6: Proposed Funding Settlement –Comparing Old Base with 1.6% Inflation Adjustments and New Base with variable Inflation Adjustments (Simulated Growth Scenario)
To fund the estimated $3.3 billion, the proposal increases disbursements from the Permanent Land Endowment Trust Funds (PLETF) from the current 2.5 percent to 6.9 percent from 2017-2025 with the 2016 appropriation set at $260 million. After 2025, the proposal sets it back to 2.5 percent. Table 7 extends to 2026 to show the increase needed from the General Fund at that point of $185 million.
Consequently the bulk of the $3.3 billion will come from PLETF and relatively little from the General Fund as shown in Table 7. Two-thirds comes from the Trust Fund. Table 7 uses the same future growth scenario as depicted in Table 6.
Table 7 Trust Fund Levels and General Fund Dollars under GCI Simulated Economic Activity
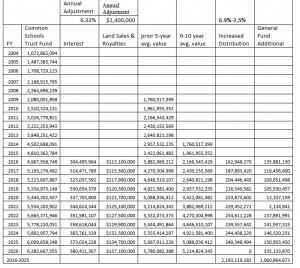
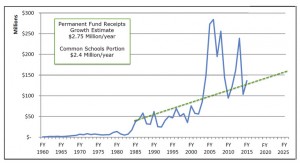
Table 7 relies on the same 6.33% growth rate that the investments in the Trust Fund have averaged over the past 15 years as was suggested by the JLBC in their June analysis of Gov. Ducey’s original plan. The Land Sales and Royalties, the recent Morrison Institute and W.P. Carey affiliated authors paper notes are much harder to predict due to varying locations of state trust land, existing leases, and complications and swings in the Real Estate Market. That paper suggests, in fact, that there could be diminishing returns at some point. The GCI best estimate for Land Sales and Royalties comes from looking at and extending a historical results table from that report. A fitted trend line, if we omit the real estate bubble of the early 2000’s as not representative of trends, leads to an estimated $2.75 million annual growth rate, which means a lowering percentage growth rate over time. As the Common Schools portion represents 87 percent of the Land Trust, $2.4 million annual growth is the estimate used for annual Land Sales & Royalties. See Figure 9 below.
Figure 9
Permanent Fund Receipts (Land Sales & Royalties) Historical and Projected
Source: Artigue, Gammage, Hunting and Stapp (2015) with extension estimate by author
Tables 8 and 9 provide the calculations for estimating the current cost of tax cuts since 1993 and 2007, respectively. Personal Income data comes from the Bureau of Economic Analysis. General Tax Fund changes is estimated by the JLBC. The Tax Change per $1,000 of Personal Income is derived by dividing the General Fund Tax Change by Personal Income. Cumulative tax changes takes the prior year’s cumulative and adds that year’s change. The cumulative tax change then multiplies that by Personal Income divided by $1,000. Adding the tax change cumulative to the ongoing tax revenue yields the tax revenue without tax changes. As can be seen in Table 8, since FY1993, the cost of tax reductions is $4 billion and the General Fund would otherwise be $13.6 billion this fiscal year. Likewise, focusing on reductions only since FY2007 generates a revenue loss of $1 billion and a General Fund that would otherwise be $10.6 billion (see Table 9).
Table 8
Cumulative Cost of Tax Changes since 1993
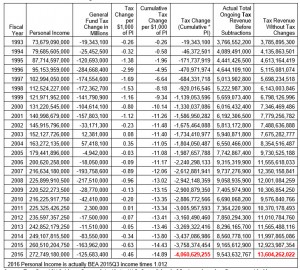
Source: Tom Rex, ASU Seidman Research Institute, W.P. Carey School of Business based on figures provided by Joint Legislative Budget Committee and Bureau of Economic Analysis.
Table 9
Cumulative Cost of Tax Changes since 2007
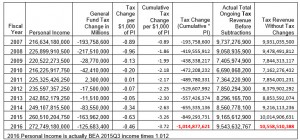
Source: Author’s calculations based on data from Tom Rex, ASU Seidman Research Institute, W.P. Carey School of Business based on figures provided by Joint Legislative Budget Committee and Bureau of Economic Analysis.
Dave Wells holds a doctorate in Political Economy and Public Policy and is the Research Director for the Grand Canyon Institute.
Reach the author at DWells@azgci.org or contact the Grand Canyon Institute at (602) 595-1025.
Grand Canyon Institute
P.O. Box 1008
Phoenix, AZ 85001-1008
GrandCanyonInstitute.org

