 Blog
Blog
Prop. 206 Impact Summary: Restaurant Employment, Wage Gains v. Job Loss, Income Distribution, and State-Contracted Disability Providers
February 12, 2018Prop. 206 Impact Summary:
Restaurant Employment, Wage Gains v. Job Loss, Income Distribution, and State-Contracted Disability Providers
Dave Wells, Research Director
Executive Summary
Below are the findings in this Impact Summary of Prop. 206, which mandated an increase in the state’s minimum wage and provided sick time to employees.
- Restaurant employment growth was modestly higher than in the preceding four years in 2017. A higher minimum wage has not diminished growth. Price impacts appear modest.
- GCI’s 2016 analysis estimated 790,000 Arizona workers would see a wage increase under Prop. 206 by 2020 and approx. 13,000 could lose employment. That still seems reasonable.
- 206 is projected to raise incomes for households with less than $50,000 in income and lower incomes for households above that level—with the greatest losses coming from higher income households due to their paying higher prices.
- The Cost for FY2018 for Disability Providers who contract with the state is $20 million (no more than $28 million). The Rounds/Goldwater Analysis appears to assume wage increases beyond Prop. 206.
Prop. 206 Impact Summary:
Restaurant Employment, Wage Gains v. Job Loss, Income Distribution, and State-Contracted Disability Providers
Dave Wells, Research Director
Executive Summary
Below are the findings in this Impact Summary of Prop. 206, which mandated an increase in the state’s minimum wage and provided sick time to employees.
- Restaurant employment growth was modestly higher than in the preceding four years in 2017. A higher minimum wage has not diminished growth. Price impacts appear modest.
- GCI’s 2016 analysis estimated 790,000 Arizona workers would see a wage increase under Prop. 206 by 2020 and approx. 13,000 could lose employment. That still seems reasonable.
- 206 is projected to raise incomes for households with less than $50,000 in income and lower incomes for households above that level—with the greatest losses coming from higher income households due to their paying higher prices.
- The Cost for FY2018 for Disability Providers who contract with the state is $20 million (no more than $28 million). The Rounds/Goldwater Analysis appears to assume wage increases beyond Prop. 206.
Impact Summary
- Restaurant employment growth was modestly higher than in the preceding four years in 2017. A higher minimum wage has not diminished growth. Price impacts appear modest.
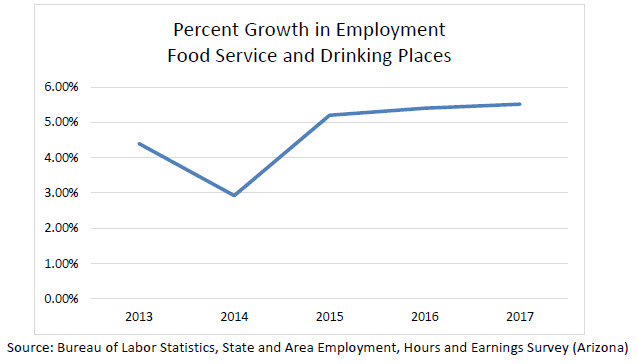
To target a sector highly dependent on minimum wage workers, the food service and drinking places sector was identified. For Arizona the percent growth in employment and food service and drinking places was modestly higher in 2017 than in 2015 and 2016 and significantly higher than in 2013 and 2014. At the surface, this suggests the higher minimum wage either did not have an adverse employment impact as some economists argued it would or had a very minor one as GCI had estimated.
Figure 1
The Rounds/Goldwater report includes misleading information related to pricing in this sector:
In an industry like the restaurant business, demand is highly elastic—if a meal out gets more expensive, fewer people will eat out. Every time a restaurant charges more for a meal, it loses customers at the margin.[1]
Of course, in economics a substitution effect occurs when the price of one good goes up relative to everything else. However, price changes at restaurants are limited because labor is only a small portion of total costs, and higher incomes leads to more purchases.
Labor costs represent about 31 percent of total costs in full-service restaurants and 25 percent of total costs in limited service restaurants.[2] Full-service restaurants may have some workers at the tipped minimum wage ($3 less in Arizona), though often pay workers above minimum wage. However, limited-service (fast food) restaurants are more likely to employ workers at or close to the minimum wage. Economic studies using data from the 1990s found that, when looking at full-service restaurants, a 10 percent increase in the minimum wage resulted in a 0.4 percent increase in prices. At limited-service restaurants, a 10 percent increase in the minimum wage generated a 1.5 percent increase in prices.[3] Consequently, GCI concluded in 2016 that if Prop. 206 passed, full-service prices might increase 1 percent in 2017 and less than an additional 1 percent by 2020, whereas limited-service prices could increase 3.6 percent in 2017 and an additional 2.4 percent in 2020. This is shown in Table 1.
Table 1 Price Impacts in Restaurant Sector from higher Minimum Wage
| $8.05 to $10 min. wage | $8.05 to $12 min. wage | |
| Full-Service | 1% | 1.6% |
| Limited-Service | 3.6% | 6% |
- GCI’s 2016 analysis estimated 790,000 Arizona workers would see a wage increase under Prop. 206 by 2020 and approx. 13,000 could lose employment. That still seems reasonable.
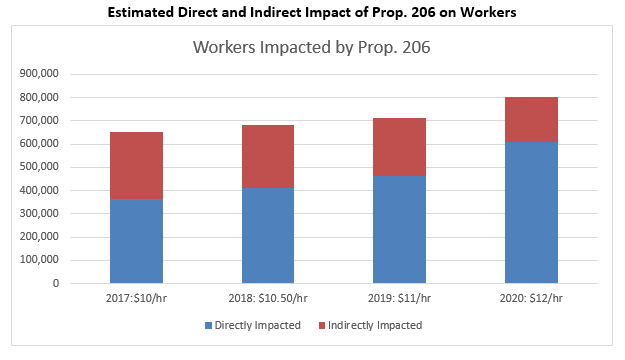
GCI estimated the wage distribution from mandated minimum wage increases under Prop. 206 using the industry wage sector data from the Dept. of Labor Statistics for Arizona and estimated that by 2020, approx. 790,000 or nearly one-third of the workforce would see some kind of wage gain due to Prop. 206. GCI also anticipated job losses of about 13,000 by 2020. Nothing in 2017 transpired to suggest the job loss estimate is too low. In fact, data so far suggests the current job losses may be on a rate below that as the economy continues toward full-employment.
Table 2
Wage Gains and Job Losses from $12 Min. Wage (Congressional Budget Office Approach)
| % increase in minimum wage: 40% | % increase in minimum wage: 15% | Indirectly affected | ||||||||
| <$10/hr. | $10 – $11.99/hr. | $12-$13.80/hr. | ||||||||
| Age | % of workers | Elasticity (CBO) | Lost Jobs (CBO) | Workers Gaining | % of workers | Elasticity (CBO) | Lost Jobs (CBO) | Workers Gaining | % of workers | Indirectly gaining |
| 16 to 19 | 17% | -0.15 | -3,679 | 56,963 | 5% | -0.1 | -185 | 12,338 | 2% | 3,780 |
| 20 to 24 | 26% | -0.10 | -3,854 | 91,425 | 21% | -0.06 | -467 | 52,313 | 14% | 26,506 |
| 25 and older | 57% | -0.05 | -4,177 | 202,350 | 74% | -0.03 | -807 | 181,472 | 84% | 162,967 |
| Total | 100% | -11,710 | 350,738 | 100% | -1,459 | 246,123 | 100% | 193,254 | ||
| Total Losses | -13,170 | Total Gains | 790,116 | |||||||
Figure 2 Direct and Indirect Impact of Prop. 206 on Workers
- 206 is projected to raise incomes for households with less than $50,000 in income and lower incomes for households above that level—with the greatest losses coming from higher income households due to their paying higher prices.
Higher Minimum Wages bring four effects:
- Boost in wages for impacted workers both those directly impacted and those indirectly impacted who get raises because their wage is close to the new minimum wage (about 790,000)
- Loss of jobs due to the higher costs (13,000 estimate)
- Higher prices due to the added costs of the minimum wage (about 1 percent across a range of services)
- Economic Growth and Employment Gains due to the higher incomes of lower wage workers (despite job losses and higher prices—about $275 million in growth and 2,000 added jobs, respectively).
Using the IMPLAN Input-Output Economic Model for Arizona combined with wage gain estimates of the Economic Policy Institute, a total impact on the economy was estimated, including an impact on state revenue.
Based on the job loss estimates provided earlier, this analysis presumed that 2.5 percent of directly affected jobs were lost. In addition, $69 billion in household expenditures for products and services where the higher minimum wage could impact prices were identified. The estimated average price increase was 1 percent for these sectors. Research on full service restaurants indicates that a $12 minimum wage should increase their prices by about 1.6 percent (where labor is 31 percent of total costs). Fast food costs would rise more (about 6 percent).[4] Most of the sectors identified, though, would be less reliant on lower wage labor. It would be higher in some cases and lower in others. Consider a typical firm where lower wage workers were 10 percent of total costs and their wages on average went up 10 percent (e.g., from $10.90 to $12 an hour), then that would generate a 1 percent increase in costs.[5]
Beyond job losses and price increases, employers will seek to improve their use of labor to be more productive. In addition, research also finds that duration of employment increases, i.e., turnover decreases, in response to the higher minimum wage.[6] This also improves productivity, as employers retain a more productive workforce and spend less time searching for replacement workers. These aspects along with the greater velocity of spending for lower wage workers compared to those with higher incomes and their greater likelihood of spending locally leads to the basis for economic growth.
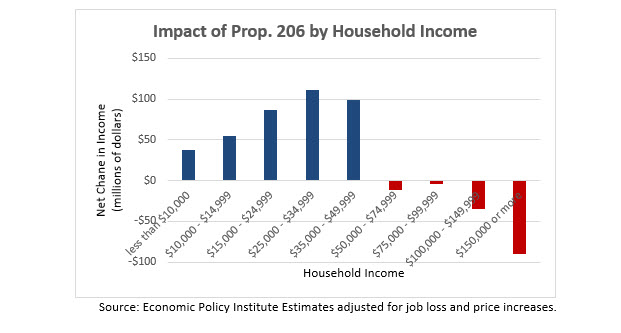
The job loss and price adjustments reduced the gain to a modest $250 million, which included net gains of about $390 million for households under $50,000 a year—and a net loss of roughly $140 million for households with incomes above $50,000 a year. The distribution of that $250 million is shown in Figure 3, which illustrates how a higher minimum wage redistributes income from higher income households to lower and middle income households.
This $250 million then is re-spent and re-circulated in the economy yielding a modest gain in economic activity of $275 million which generates 2,000 additional jobs. Note that these events are interrelated, not sequential. The added demand is happening at the same time prices are adjusting.
Figure 3
- The Cost for FY2018 for Disability Providers who contract with the state is $20 million (no more than $28 million). The Rounds/Goldwater Analysis appears to assume wage increases beyond Prop. 206.
The Goldwater Institute contracted with economist Jim Rounds to evaluate the fiscal impact on state contracts to developmental disability providers.[7] GCI had already done an evaluation of that estimate last March. GCI aims to provide a transparent methodology for its work. Unfortunately, the Rounds/Goldwater estimate of a $45 million impact is just stated without a derivation. However, based on reading the report and GCI’s familiarity with the AAPPD data, we believe to have identified the assumptions necessary to reach $45 million.[8] GCI stands by its prior estimate of $20 million for FY2018—though if 70 percent of costs were low wage workers, that could be as high as $28 million—but GCI never received documentation to back up 70 percent. See Table 3.
Table 3
| AAPPD /Rounds-Goldwaterfrom $9.54 avg. wage | GCIfrom $9.54 avg. wage | GCIfrom $10.05 avg. wage | ||||
| July-Dec. 2017 | Jan.-June 2018 | July-Dec. 2017 | Jan.-June 2018 | July-Dec. 2017 | Jan.-June 2018 | |
| New Avg. Wage | $10.85 | $12.44 | $11.04 | $11.39 | $11.42 | $11.77 |
| min wage increase | $1.95 | $0.50 | $1.95 | $0.50 | $1.95 | $0.50 |
| Avg. Wage Increase | $2.31 | $0.59 | $1.60 | $0.35 | $1.37 | $0.35 |
| % Increase from Dec. 31 2016 | 24.2% | 30.4% | 15.8% | 19.4% | 13.6% | 17.1% |
| Adjustments | ERE 1.0 | ERE 1.0Sick Pay +1.7%Turnover Savings -1.2% | ERE 1.0Sick Pay +1.7%Turnover Savings -1.2% | |||
| Total Increase | 24.2% | 30.4% | 16.3% | 20% | 14.1% | 17.6% |
| Low Wage +ERE as % of Total Costs | 70% | 50% | 50% | |||
| Net Increase | 16.9% | 21.3% | 8.2% | 10% | 7.1% | 8.8% |
| Service Dollars Impacted | $379 M | $379M | $379 M | $379M | $379 M | $379M |
| State Share | 0.3076 | 0.3076 | 0.3076 | |||
| Added Cost | $19.7 M | $24.8 M | $9.5 M | $11.6 M | $8.2 M | $10.3 M |
| Total FY2018 | $44.5 M | $21.1 M | $18.5 M | |||
Reviewing Table 3, the first difference is in the percent increase in wages. The average wage goes up by more than the minimum wage increase under the AAPPD assumptions. That’s not a plausible outcome in labor markets. If wages went up that much—then it was not caused purely by Prop. 206. The maximum increase would be the increase in the minimum wage. Economic models generally presume that workers earning above the minimum wage currently will see a portion of the increase with workers whose wages are much higher than the minimum wage, workers seeing little or no gain. While the direct caregivers will see higher wages, someone earning twice the minimum wage would likely see no change. Because direct caregivers were already above minimum wage, they would see a portion of the increase to the minimum wage, not something larger than the minimum wage increase. So rather than a $1.95 increase in the minimum wage leading to $2.35 rise in average wages, GCI estimates the increases as $1.60 if the average. wage is $9.54 and $1.37 if the average. wage is $10.05.[9]
Using wage and expenditure data from Oregon which is far more comprehensive than what is publicly available for Arizona, GCI found for Providers for those with Intellectual and Developmental Disabilities (IDD) that wages + ERE were approximately 50 percent of total state and federal spending on IDD services. [10] This figure assumed an ERE of 25 percent, greater than the 17.3 percent used in Arizona, because far more workers in Oregon are full-time and get benefits. AAPPD did indicate that 70 percent was accurate to GCI but did not provide documentation, consequently, 70 percent may be total wage/salary and ERE, not just lower-wage + ERE. If 70 percent were accurate then GCI’s estimates would be 40 percent higher.
Dave Wells holds a doctorate in Political Economy and Public Policy and is the Research Director for the Grand Canyon Institute, a centrist fiscal policy think tank founded in 2011. He can be reached at DWells@azgci.org or contact the Grand Canyon Institute at (602) 595-1025 ext. 2.
The Grand Canyon Institute, a 501(c) 3 nonprofit organization, is an independent think tank led by a bipartisan group of former state lawmakers, economists, community leaders and academicians. The Grand Canyon Institute serves as an independent voice reflecting a pragmatic approach to addressing economic, fiscal, budgetary and taxation issues confronting Arizona.
Grand Canyon Institute
P.O. Box 1008
Phoenix, Arizona 85001-1008
GrandCanyonInsitute.org
[1] Rounds, Jim (2018) for Goldwater Institute, “The Unintended Consequences of Minimum Wage Increases on the Taxpayer: A Case Study of Services for Individuals with Developmental Disabilities,” Feb. 5, p. 3 https://goldwaterinstitute.org/wp-content/uploads/2018/02/The-Unintended-Consequences-of-Minimum-Wage-Increases.pdf.
[2] Fougere, Denis, Erwan Gautheir, Herve Le Bihan (2010), “Restaurant Prices and the Minimum Wage,” Journal of Money, Credit and Banking, Vol. 42, Nov. 7, October, pp. 1199-1234..
[3][3] McDonald, James M. and Daniel Aaronson (2006), “How Firms Construct Price Changes: Evidence from Restaurant Responses to Increased Minimum Wages,” American Journal of Agricultural Economics, Vol. 88, pp. 292-307, http://naldc.nal.usda.gov/download/6852/PDF (accessed October 2, 2016).
[4] See Lemos, Sara (2008), “A Survey of the Effects of the Minimum Wage on Prices,” Journal of Economic Surveys, Vol 22, No. 1, pp. 187-212; .Fougere, Denis, Erwan Gautheir, Herve Le Bihan (2010), “Restaurant Prices and the Minimum Wage,” Journal of Money, Credit and Banking, Vol. 42, Nov. 7, October, pp. 1199-1234; and McDonald, James M. and Daniel Aaronson (2006), “How Firms Construct Price Changes: Evidence from Restaurant Responses to Increased Minimum Wages,” American Journal of Agricultural Economics, Vol. 88, pp. 292-307, http://naldc.nal.usda.gov/download/6852/PDF (accessed October 2, 2016).
[5] Fougere, Denis, Erwan Gautheir, Herve Le Bihan (2010), “Restaurant Prices and the Minimum Wage,” Journal of Money, Credit and Banking, Vol. 42, Nov. 7, October, pp. 1199-1234.
[6] Dube, Arindajit, T. William Lester, and Michael Reich (2014), “Minimum Wage Shocks, Employment Flows and Labor Market Frictions,” Institute for Research on Labor and Employment Working Paper #149-13, October, http://irle.berkeley.edu/files/2013/Minimum-Wage-Shocks-Employment-Flows-and-Labor-Market-Frictions.pdf (accessed February 10, 2017).
[7] Rounds, Jim (2018) for Goldwater Institute, “The Unintended Consequences of Minimum Wage Increases on the Taxpayer: A Case Study of Services for Individuals with Developmental Disabilities,” Feb. 5, https://goldwaterinstitute.org/wp-content/uploads/2018/02/The-Unintended-Consequences-of-Minimum-Wage-Increases.pdf.
[8] Table 3 AAPD column is based on, but slightly modified to match statements in Rounds-Goldwater. See Table 1 Wells, Dave (2017), “Prop. 206: Impact on Developmental Disability Providers,” Grand Canyon Institute, March 7, https://grandcanyoninstitute.org/prop-206-impact-on-developmental-disability-providers/.
[9] For $9.54, GCI takes 46 cents as mandated, and then wages go up 70 percent of the remainder of the min. wage increase ($1.95-$0.46). For $10.05, none is mandated, so GCI presumes wages go up 70 percent of $1.95.
[10] For Oregon total spending on Intellectually and Developmental Disabilities (IDD)from Lewin Group (2016), “Bending the Curve: Opportunities to Promote Sustainability in Oregon’s Long-Term Services and Support System: Draft Final Report,” Prepared for Oregon Department of Human Services; Aging and People with Disabilities and the Office of Developmental Disabilities Services, Feb. 10, http://www.o4ad.org/uploads/5/9/2/2/59228911/lewin_or_ltss_final_report.pdf (accessed March 6, 2017). For number of IDD employees, including wages, portion full-time, and benefits from Zuckerbraun, Sara, Joshua M. Wiener, et al.. (2015), “Wages, Fringe Benefits, and Turnover for Direct Care Workers Working for Long-Term Care Providers in Oregon”, Prepared for Oregon Dept. of Human Services, January, Wages, Fringe Benefits, and Turnover for Direct Care Workers Working for Long-Term Care Providers in Oregon (accessed March 6, 2017)


