Policy Paper
August 22, 2016
Education Measures Not Business Indices Correlate with a Better Economy:
Ranking the 50 States
Dave Wells, Ph.D.
Research Director, Grand Canyon Institute
Executive Summary
What’s Better Economic Performance?
On many social welfare and education indices Arizona ranks low. On many tax and business policy indices Arizona often ranks quite well. Arizona has for decades experienced much stronger job growth than the nation as a whole, though not so much recently. This report looks at state economic performance using four measures:
- Growth in Real State Gross Domestic Product Per Job
o a measure of productivity growth
o 2001-2014 (longer-term, the last two expansions)
o 2009-2014 (this expansion only),
- Growth in Per Capita Personal Income Growth
o a measure of income growth
o 2001-2015 (longer-term, the last two expansions)
o 2009-2015 (this expansion only),
- Unemployment rate (average of the U3 and U6 rate as captured over the last year), and
- Gini Coefficient for Personal Income Growth from 2009-2014 (a measure of inequality)
Certainly, we measure the economy in many ways, so why these four measures?
First, if we just measure aggregate “growth” as is often the case, we capture the impact of two different things, growth in individual well-being and growth in the population. If a population grows substantially, the economy will grow, but that doesn’t necessarily mean that individual well-being improves.
If a population grows substantially, the economy will grow, but that doesn’t necessarily mean that individual well-being improves.
|
Real Gross State Domestic Product captures the added value of all new goods and services produced in the state measured in inflation-adjusted dollars, so increases in output, not higher prices increase it. Those goods and services are produced by individual proprietors and those employed by others. So dividing it by total employment gives us an indicator of the economy’s productivity. However, the benefits of real GDP need not stay in the state. Corporate profits, for instance, may go to entities and individuals outside the state and much of the growth early in the expansion went to profits.
Personal Income by contrast measures all incomes accruing to people who reside in the state. However, not all of it is wages and salaries. About one-third of it is dividends, interest and rent (DIR) as well as transfer payments (e.g., Social Security). These passive income earning activities may not originate in the state. However, DIR and transfer payments are an important component of individual well-being. To correct for population changes, however, we divide personal income by population to get state per capita personal income.
For both of these measures the focus is not on the absolute value as some states start at much higher levels than others, but on its growth. Economic growth is best measured over a span of years, so these measures includes the last two business cycles, starting from 2001 and the last business cycle starting from 2009.
To evaluate how well the state labor market is functioning, the unemployment rate is considered for the last year. U3 is the unemployment rate that gets the most publicity, measuring those actively looking for work in the past month divided by those currently employed plus those actively looking for work. This is the conventional unemployment rate. U6 is the broadest measure of labor underutilization. U6 includes unemployment and underemployment—including those actively looking for work, and those who have been employed or sought work in the last 12 months but haven’t looked in the last month due to obstacles or becoming discouraged. In addition, it includes those working part-time that are not able to find full-time work due to a lack of full-time work or obstacles (e.g., affordable child care) that prevent it. U6 is roughly twice as large as U3.
Taking the average of U3 and U6 gives a priority to those most actively seeking work, but still includes a measure of the broader labor market.
Finally, growth in real GDP per job and growth in per capita personal income ignores who receives that income. The Gini coefficient ranges from 0 to 1 and is based on how much the distribution of income deviates from perfect equality. A Gini coefficient of 0 indicates everyone had the same income and a Gini coefficient of 1 means all income was held by one household. In this case, the analysis looks at the recent change in personal income 2009-2014 and how that change in income has been distributed. If in State A income increased 10 percent and all households had their incomes go up by 10 percent, then the Gini coefficient would not change. So the Gini coefficient for added income would be the same as the state’s Gini coefficient. But if in State B upper income families grew by 20 percent and lower income families did not grow at all, then the Gini coefficient would rise, and the Gini coefficient for added income would be higher than the state’s prior Gini coefficient to capture that higher level of inequality. Likewise, if in State C, lower income families incomes rose by 20 percent and higher income families did not change, then the Gini would move in the direction of greater income equality, and the Gini coefficient for additional income would capture that. With respect to these three cases, the last case, State C would rank best, the state with equal gains would rank in the middle and the state where only upper income people gained would rank worst.
Collectively, these four measures provide an inclusive measure of the economic performance of a state. Each of the 50 states were ranked on each measure, and then ranked again from the state that had the best average ranking to the state which had the worst one.
Table 1 looks at half the states for Economic Performance: the top 15 and bottom 10. Unfortunately, Arizona is the only state to rank in the bottom ten for all four criteria.
Table 1
State Rank by Economic Performance Variable (Top 15, Bottom 10)
| State |
GDP per Job2001/2009-2014 |
PC PI2001/2009-2015 |
UnemploymentRate |
Gini2009-2014 |
Avg. Rank |
ECONOMIC PERFORMANCE |
| North Dakota |
1 |
1 |
1 |
14 |
4.25 |
1 |
| Nebraska |
5 |
10 |
3 |
2 |
5 |
2 |
| Oklahoma |
4 |
3 |
15 |
11 |
8.25 |
3 |
| South Dakota |
6 |
23 |
2 |
3 |
8.5 |
4 |
| Iowa |
2 |
18 |
5 |
17 |
10.5 |
5 |
| New Hampshire |
16 |
12 |
4 |
12 |
11 |
6 |
| Texas |
10 |
8 |
13 |
21 |
13 |
7 |
| Vermont |
17 |
9 |
9 |
22 |
14.25 |
8 |
| Hawaii |
26 |
15 |
11 |
6 |
14.5 |
9 |
| Arkansas |
7 |
7 |
21 |
28 |
15.75 |
10 |
| Minnesota |
9 |
21 |
8 |
27 |
16.25 |
11 |
| Wyoming |
46 |
2 |
16 |
5 |
17.25 |
12 |
| Wisconsin |
13 |
33 |
14 |
10 |
17.5 |
13 |
| Montana |
8 |
6 |
17 |
40 |
17.75 |
14 |
| Utah |
30 |
25 |
7 |
9 |
17.75 |
14 |
|
|
|
|
|
|
|
| Illinois |
35 |
38 |
41 |
30 |
36 |
41 |
| Connecticut |
44 |
22 |
33 |
48 |
36.75 |
42 |
| Delaware |
43 |
49 |
24 |
35 |
37.75 |
43 |
| North Carolina |
37 |
46 |
38 |
31 |
38 |
44 |
| Maine |
41 |
43 |
19 |
50 |
38.25 |
45 |
| New Mexico |
27 |
30 |
49 |
47 |
38.25 |
45 |
| Florida |
48 |
45 |
32 |
38 |
40.75 |
47 |
| Nevada |
50 |
50 |
50 |
15 |
41.25 |
48 |
| Georgia |
47 |
48 |
39 |
32 |
41.5 |
49 |
| Arizona |
42 |
47 |
44 |
42 |
43.75 |
50 |
What best correlates with Better Economic Performance? Business or Education Indices?
Policymakers frequently express a desire to improve economic prosperity. The best business climate lists typically infer that higher ranking states do better economically. Some argue that tax measures, regulatory indices, and/or labor cost indices are the most important indicators. Collectively, these form the main basis of many business indices.
On the opposite end would be to focus on labor quality, emphasizing educational outcomes and attainment.
This study looks at state outlook rankings put together in 2009 which purported to predict how states would perform moving forward as well as the most current version of those rankings to see how well they correlate with the Economic Performance Index.
On the opposite side, the study examines how well education measures correlate with better economic performance.
These are the indices evaluated.
- American Legislative Exchange Council (2009 and 2016 rankings)
o ALEC’s Economic Outlook rankings are based on having top personal or corporate tax rates that are low, regressive income tax structures (if income goes up, tax burden going down is preferred), requiring that unionized workplaces be open (no one is required to join the union), low taxes overall, recent changes that reduce taxes, a low minimum wage, fewer state employees per 10,000 population, and expenditure controls on state government.
o Arizona has historically ranked very highly with ALEC. In 2009 Arizona ranked 3rd. In 2016 Arizona ranked 5th.
- Chief Executive Magazine (2009 and 2016 rankings)
o Chief Executive Magazine completes an annual survey of 513 CEO’s to rank states based on the “friendliness of their tax and regulatory regime, workforce quality and living environment (This latter category includes not just the cost of living but the education system and the state and local attitudes toward business).”
o Arizona has historically been ranked highly by Chief Executive Magazine. In 2009 Arizona ranked 8th. In 2016 Arizona ranked 6th.
- Forbes Best States for Business (2009 and 2015 rankings)
o Forbes factors in 40 data points across six areas to determine their rankings.
- Forbes most heavily weighs their business cost index which relies heavily but not exclusively on Moody’s Analytics Cost of Doing Business.
- Forbes’ other categories include labor supply which looks at educational attainment and net migration.
- The regulatory score is largely impacted by the “Freedom in the 50 States” Report of the Mercatus Center at George Mason University.
- Their economic climate portion focuses on changes in jobs, income (not clear if per capita or just growth in personal income generally), Gross State Product, and unemployment over the past five years.
- Growth prospects is based on Moody Analytics expectations for jobs, income and gross state product going forward, and
- Finally, Quality of Life includes cost of living, public education test scores (may not be demographically adjusted), crime rates, average temperature, and cultural and recreational amenities.
o Arizona ranked 36th in 2009 and had risen to 23rd by 2015. In 2015 Arizona’s best areas were growth prospects (7th) and labor supply (15th). Its worst areas were quality of life (40th) and economic climate (34th).
- Tax Foundation (2010 and 2016 Business Tax Climate Rankings)
o The tax foundation looks at over 100 tax variables across five areas: corporate, individual income, sales, property and unemployment insurance to determine their ranking.
o Arizona has done fair with the Tax Foundation. In 2010 Arizona ranked 28th and by 2016 Arizona was 24th.
To these business rankings four measures of educational outcomes plus combined educational outcome measures were examined.
- 2005-2009 NAEP 8th grade free and reduced lunch-adjusted math and reading scores
o Includes 2005, 2007 and 2009 with a random selection of schools selected from each state designed to be representative.
o In 2009, 2005 cohort would be graduating from high school. In 2015, the 2007 cohort would include some graduating from college. This measure provides one indicator of school quality.
o Free and Reduced Lunch-adjusted students means that each state’s scores were split evenly between students on free and reduced lunch and those not qualifying for the program, so on that level all states were demographically identical. NAEP on line data does not enable more sophisticated controls for income and other aspects. The two sets of math and reading scores were then added for each year, then added across the three years of testing and the states ranked. To qualify for free and reduced lunch a student’s family must be no higher than 185 percent of the federal poverty line.
o Arizona ranks 41st.
- 2003-2009 High School Graduation Rates
o Uses Average Freshman Graduation Rate (AFGR). Takes the number of students receiving high school diplomas divided by the size of its freshman class four years earlier.
o These students would be 18 to 24 in 2009 and 24 to 30 years old in 2015
o This is based on the percent of freshman graduating four years later as collected from the states and published by the National Center for Educational Statistics
o Arizona ranks 37th.
- 2012-2013 Economically-adjusted High School Graduation Rates
o Uses Adjusted Cohort Graduation Rate (ACGR). Under the guidelines of No Child Left Behind, the National Center for Educational Statistics has developed a new student tracking based system that tracks actual students who were freshman and what percent of them actually graduate in four years. The 2011 graduating year was the first year data became available.
o NCES data includes “economically disadvantaged” students but No Child Left Behind gave the states the ability to define what that constituted. The Everybody Graduates Center in the School of Education at Johns Hopkins University beginning with its annual report in 2014 for the class of 2012 breaks down for each state the percent of students considered “low income” and “nonlow income.” It also uses NCES data to indicate what the graduation rate for each state was for “low income” and “nonlow income” students. The economically-adjusted graduation rates averages the low income and nonlow income graduation rates for each state across the two years and then ranks them to create an economically-adjusted high school graduation rate that gives each state equivalent demographics across these two categories.
o Arizona ranked 40th.
- 2005-2012 percent change in adults 25-64 with an Associate degree or higher (years limited due to data availability)
o Certainly more people with higher levels of educational attainment correlate with higher incomes. This measure looks at data from the American Community Survey at the percentage change of prime working age adults 25-64 who have earned an Associate degree or higher. This could reflect the impact of in-migration for higher quality jobs as well as improvement longer term residents’ educational credentials.
o Arizona ranks 42nd.
- Combined Education Measures
o Average ranking for states across the four education measures( then re-ranked)
o Average rankings for states across three of the education measures using only one of the two high school graduation measures, so that is not weighted stronger.
o Arizona ranked 45th in two and 49th in the other.
The Results
Rankings were correlated with economic performance, which examines how well they coincide with each other. For instance, in baseball the more strikeouts per 9 innings that a pitcher gets has been found to negatively correlate with batting average, meaning more strikeouts generally results in fewer hits. At the Olympics we find that a country’s per capita Gross Domestic Product correlates with the number of athletes they send to the games. If very small population countries are eliminated, this correlation increases. Essentially wealthier countries send more athletes to the Olympic Games.
Correlations range from -1 (perfectly negatively correlated) to +1 (perfectly positively correlated). To illustrate, among countries with a population of 10 million or more, there is a 0.72 correlation between the number of athletes sent to the Rio Olympics and the country’s Gross Domestic Product per person (or per capita). For instance, the Netherlands (pop. 14 million) has a per capita GDP of $49,200 and sent 237 athletes to Rio. Chile (pop. 17.5 million) has a per capita GDP of half as much $23,500 and sent 41 athletes, while Zambia (pop. 15 million) has a per capita GDP of $3,900 and sent only 7 athletes.
In this study’s case we have two sets of rankings from best to worst, 1 to 50, and the question is whether a particular ranking correlates positively with economic performance.
Figure 1 shows the scatterplot for the 2009 ALEC Economic Outlook rankings and Economic Performance along with the 2003-2009 High School Graduation Rate and Economic Performance.
Figure 1
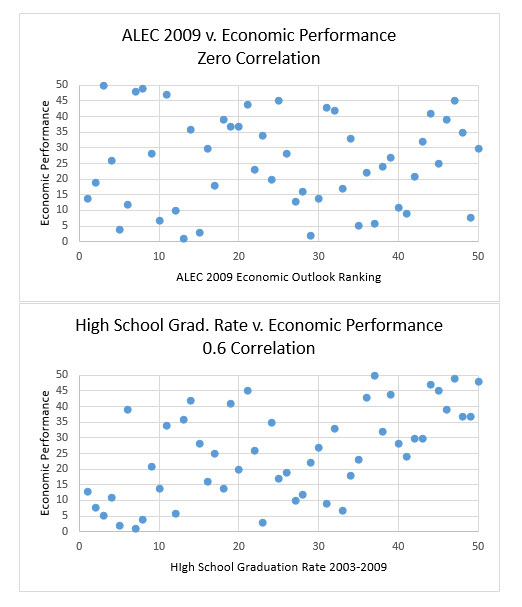
The ALEC 2009 graph shows no discernable relationship at all. In fact, the mathematical correlation comes out as 0, technically .003.
The High School Graduation Rate is scattered, but also shows a trend. None of the worst economic performance states had top high school graduation rates (blank space in upper left) and none of the best economic performing states had low high school graduation rates (blank space in lower right). The two indices correlate—as one goes up (performance decreasing), so does the other. In this case, the mathematical correlation was 0.571 and due to the greater concentration of the dots, we’re more than 99 percent sure that in fact there is a positive relationship here.
All of the business measures fail to correlate with economic performance with the exception of the Forbes Best Business Climate Index. However, even Forbes’ best states for business index comes nowhere close to how well each of the education measures correlate with economic performance.
|
In Table 2 below you’ll see a bolded number for the correlation for each of the indices and Economic Performance (including the ALEC index). That indicates how strongly the two move in tandem. The number in parenthesis below the bold number indicates how likely the correlation in bold could in fact be zero or not aligned with economic performance. The .573 result for the high school graduation has essentially no likelihood of being zero or in a negative direction.
In Table 2 * indicates that the probability is 10 percent or less that the relationship could be zero or negative. ** indicates that the probability is 5 percent or less that the relationship could be zero or negative, and *** indicates a probability is 1 percent or less that the relationship could be zero or negative.
All of the business measures fail to correlate with economic performance with the exception of the Forbes Best Business Climate Index. The correlation for Forbes is low to modest .234 in 2009 and .284 in 2015. And the probabilities that these could be zero or negative relationships are 10.3 percent in 2009 and 4.6 percent in 2015. This particular index is most sensitive to including changes in GDP per job as part of Economic Performance. When that portion is weighted more, Forbes’ index improves. When it is omitted, Forbes’ index drops off. The other business indices failed no matter what components and weights were included in Economic Performance.
However, even Forbes’ best states for business index comes nowhere close to how well each of the education measures correlate with economic performance.
The correlation of economic performance with 2005-2009 free and reduced lunch-adjusted 8th grade NAEP scores was .409. The correlation with 2003-2009 High School Graduation rates was, as already noted, .571. The 2012-2013 Economically-adjusted High School Graduation rates correlate with economic performance at .480. Finally, the correlation with the percent change in adults age 25-64 with an Associate Degree or higher was .406. The probabilities for all four of these education measures being positively correlated with Economic Performance was better than 99 percent. In addition, the NAEP result correlates very strong with the High School Graduation rate. The Economic Performance Index’s findings for education were robust through seven different formulations of the index which adjusted factors included and the weight of certain growth factors. No matter what the specification, the correlation with education was strongly positively correlated with economic performance.
| When the education rankings are averaged across the states and re-ranked, the combined education indicators correlate 0.6 with economic performance, more than twice the correlation of the best business index. |
Collectively, when the education rankings are averaged across the states and re-ranked, the combined education indicators correlate 0.6 with economic performance, more than twice the correlation of the best business index, Forbes, and six times greater than the typical business climate index’s correlation with economic performance.
The full study also finds that all the business indices correlated better with a political index (state percentage vote in 2012 for Romney) or in some cases something not related to economic performance at all, the final NCAA Men’s public state university basketball rankings (a.k.a. March Madness), than they did with economic performance.
Findings relative to Economic Performance are detailed in Table 2 (below).
Table 2
| Measure |
 ECONOMIC PERFORMANCECorrelation with 4-Factor Ranking of 14 and 6 year growth in both Real GDP per job and Per Capita Personal Income, Unemployment with Underemployment, and how equally growth is distributed, 1 to 50. ECONOMIC PERFORMANCECorrelation with 4-Factor Ranking of 14 and 6 year growth in both Real GDP per job and Per Capita Personal Income, Unemployment with Underemployment, and how equally growth is distributed, 1 to 50. |
CORRELATES withECONOMIC PERFORMANCE? |
| ALEC 2009 Economic Outlook Ranking |
.003(.983) |
 |
| ALEC 2016 Economic Outlook Ranking |
.098(.497) |
|
| Chief Exec. Magazine CEO Survey 2009 |
-.035(.810) |
|
| Chief Exec. Magazine CEO Survey 2016 |
.016(.911) |
|
| Forbes Best Business Climate 2009 |
.234*(.103) |
 |
| Forbes Best Business Climate 2015 |
.284**(.046) |
|
| Tax Foundation Business Tax Climate 2010 |
.030(.834) |
|
| Tax Foundation Business Tax Climate 2016 |
.060(.681) |
|
| 2005-2009 NAEP free and reduced lunch-adjusted 8th grade reading and math scores |
.409***(.003) |
|
| 2003-2009 Average High School Graduation Rate |
.571***(.000) |
|
| 2012-2013Economically-adjusted High School Graduation Rate |
.480***(.000) |
|
| 2005-2012 Percent Change in adults 25-64 with Associate degree or higher |
.406***(.003) |
|
| Measure |
ECONOMIC PERFORMANCECorrelation with 4-Factor Ranking of 14 and 6 year growth in both Real GDP per job and Per Capita Personal Income, Unemployment with Underemployment, and how equally growth is distributed, 1 to 50. |
CORRELATES with ECONOMIC PERFORMANCE? |
| COMBINED EDUCATION MEASURES |
| All FourThree (High School, NAEP, Assoc. Degree)Three (High School Adj., NAEP, Assoc. Degree) |
.610***(.000).598***(.000) .579***(.000) |
|
Conclusion
Business Climate indices may get a lot of press and emphasis from policymakers, but they do not correlate with Economic Performance. Education measures do. The educational attainment of its labor force is probably the most important area for a state to focus on, if it wishes to improve its economic performance. Improvements take investments, not simply policy moves.
Figure 2 summarizes the results of Table 2. Educational outcomes have a dramatically stronger correlation with economic performance than any of the business measures.
Figure 2
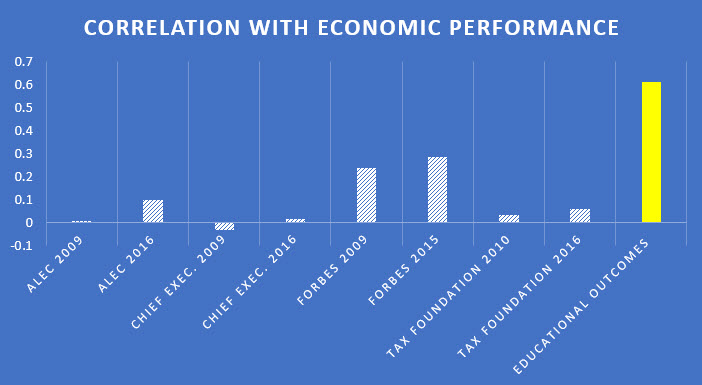
The educational attainment of its labor force is probably the most important area for a state to focus on, if it wishes to improve its economic performance.
|
Educational outcomes will continue to impact Arizona, as the K-12 system prepares a future workforce. Arizona’s 8th grade NAEP free and reduced lunch-adjusted improvement in 2013-2015 relative to 2005-2009 is the fifth highest in the nation. This outcome suggests a good initial trajectory and worth a more careful examination.
High School graduation rates though look less promising. The 2012 and 2013 graduation rates for Arizona were only modestly higher than the average of 2003 to 2009. Many other states improved more and Arizona’s relative ranking dropped to 42nd from 37th. , using the Average Freshman Graduation Rate. Looking at the Adjusted Cohort Graduation Rate, Arizona is one of only three states that had has seen its graduation rate drop from the class of 2011 to the class of 2014. The drop in Arizona from 78 percent to 75.7 percent (-2.3 percent) is the largest drop in the country. Arizona’s graduation rate is the sixth lowest in the country.
Arizona has been a leader in cutting taxes including a so-called jobs bill that reduces taxes by more than half a billion dollars annually during this decade. Arizona has also been a leader in “school choice,” while at the same time falling significantly behind other states in its level of educational investment. Prop. 123 was a good initial step to rectify the failure of Arizona’s lawmakers to meet the legal minimum funding for K-12 education, but real improvement will take a more significant targeted investment in education.
Introduction
In June when the Center for the Future of Arizona and the Arizona Commerce Authority announced they’d be tracking six measures that they felt correlated with an improved economy, a debate in the opinion pages of the Arizona Republic ensued over whether these were the best measures. Some critics cited other lists from the American Legislative Exchange Council and Forbes Magazine.[1]
This report examines Arizona’s economic performance and what does correlate with better performance. Frequently, policymakers cite various lists as evidence that their policies are improving Arizona’s economic status. Yet rarely are these lists scrutinized for their effectiveness. This study goes back to best business climate lists from 2009 as well as currently to see how well, in fact, they correlate with better economic performance.
One central dispute surrounds “jobs.” Many indices center on job-creation as an end in itself, but the real economic goals should be reducing unemployment, so those seeking jobs find work, and improving the incomes of residents. Most economic growth measures focus too much on business costs elements or have their own preferred policies to rank highly. Generally, they lack sufficient educational elements, consequently while they do correlate with a half century trend in the movement of the population from the North and Midwest to the South, including the Southwest, this is because they conflate growth due to more people with growth that improves the standard of living. The latter should be the primary goal of our economic policies.
This study finds that business tax indices and business climate indices fail to correlate with improved economic conditions, but that education indicators: the high school graduation rate, free and reduced lunch-adjusted 8th grade NAEP scores, and growth in the percent of resident adults age 25-64 with at least an Associate degree do correlate quite well with economic performance.
Unfortunately, Arizona ranks last in economic performance and the area with the strongest connection, education, is where Arizona has not made a fiscal policy priority or substituted politically favored policies (e.g., “educational choice”) in place of significant investments. This study’s results suggest if Arizona wishes to improve its economic performance, it needs to realign its fiscal priorities from reducing revenues through tax cuts to improving educational investments.
Measuring Economic Growth
Economic growth is a long-term outcome of policy, demographic, and economic circumstance. Arizona, during periods of both higher and lower taxes, has had a fairly consistent pattern of population and employment growth exceeding the national average as shown in Figure 3.
Figure 3
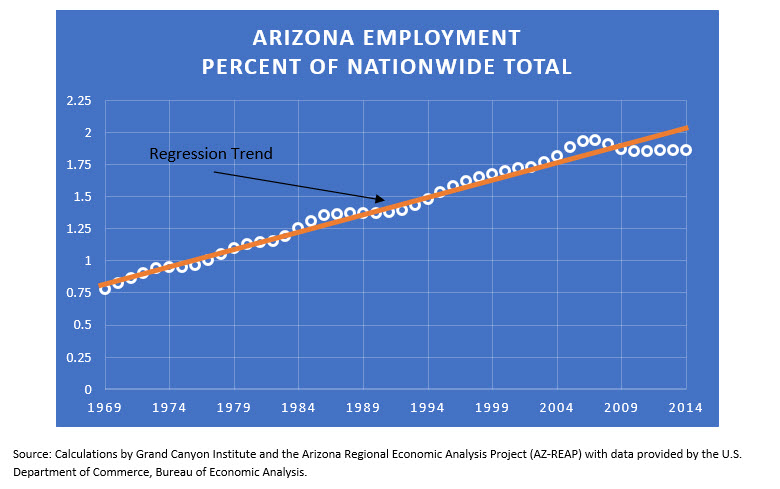
Regression analysis estimates that the Arizona to United States Employment ratio increases by 0.027 percent per year during the time period and that regression estimate (solid line) very nearly matches actual performance during the first 35 years of the period, 1969-2004.
This represents an impressive period of relative population and employment growth that during this time period is only exceeded by Nevada.
The period since 2005 shows some abnormality from the past, exceeding the trend during the housing price boom, and then showing significant sluggishness since the 2008-2009 economic collapse. Nevada shows a similar pattern. Arizona and Nevada were two of the four states hardest hit by the housing price collapse. The other two, California and Florida, have shown better employment recoveries. These outcomes are shown in Table 3.
Table 3
|
Employment as a Percent of National Total |
|
Arizona |
California |
Nevada |
Florida |
| 2005 |
1.88 |
11.74 |
0.89 |
5.88 |
| 2006 |
1.93 |
11.72 |
0.92 |
5.95 |
| 2007 |
1.94 |
11.7 |
0.92 |
5.91 |
| 2008 |
1.91 |
11.59 |
0.91 |
5.77 |
| 2009 |
1.87 |
11.5 |
0.87 |
5.7 |
| 2010 |
1.85 |
11.44 |
0.86 |
5.71 |
| 2011 |
1.85 |
11.44 |
0.86 |
5.74 |
| 2012 |
1.86 |
11.64 |
0.85 |
5.77 |
| 2013 |
1.86 |
11.79 |
0.86 |
5.82 |
| 2014 |
1.86 |
11.86 |
0.87 |
5.87 |
| 2014 as % of 2007 |
96% |
101% |
95% |
99% |
| 2014 as % of 2010 |
99% |
103% |
100% |
103% |
Source: United States Regional Economic Analysis Project (US-REAP) and State Level Regional Economic Projects with data provided by the U.S. Department of Commerce, Bureau of Economic Analysis.
Consequently, historically, any economic growth measure that included job growth as a factor would show Arizona doing well from 1969-2007. But these changes are largely exogenous to state policy, as it has included times of higher investment in education with higher taxes and the more current experience of less comparative investment in education and reduced taxes. Arizona’s favorable climate, improved transportation, and geographical proximity to the nation’s most populous state, California, are likely the most significant factors for the relative growth.
Measuring Economic Performance
The state could continue to aim to grow numerically, but more likely a greater preference would be to grow by improving the economic standard for Arizona residents. To avoid confusion with the word “growth,” the term “Economic Performance” is used instead.
While a myriad of economic statistics exist. This study identifies four key factors that collectively give a good sense of economic performance:
- Growth in Real State Gross Domestic Product per Job
- For the period 2001-2015 and for the period 2009-2015
- Growth for two periods averaged and states ranked
- Captures last two business cycles with emphasis on the current one
- Measure includes value of all goods and services produced in a state at constant prices. Divided by Jobs creates a productivity indicator.
- Does not measure how the growth is distributed
- Growth in Per Capita Personal Income
- For the period 2001-2015 and for the period 2009-2015
- Growth for two periods averaged and states ranked
- Captures last two business cycles with emphasis on the current one
- Measures all income accruing to persons residing in a state including incomes from salary, wages, property, investments and transfer payments (e.g., Social Security) and is a wider measure than Household income
- It excludes retained corporate profits, changes in inventory valuation and business property depreciation
- Does not measure how the growth is distributed
- Average of U3 and U6 Unemployment Rate 2015 Q2: 2016 Q1 (latest year)
- Measures labor market performance in providing jobs to residents
- U3 is the standard unemployment rate. Those who have active sought employment in the last month divided by those employed plus those actively seeking work.
- U6 is a broader measure of unemployment and underemployment. It adds to those unemployed under U3 anyone who has had a job or looked for one in the last 12 month, even if they are not currently working because they became discouraged or have obstacles (e.g., lack of reliable transportation) getting in the way. In addition, it includes those employed part-time but would like to work full-time, but either cannot find full-time work or obstacles (e.g., affordable or available child care) prevent it.
- Gini Coefficient 2009-2014
- Examines how growth is distributed across low, middle and high income residents
- Gini Coefficient of 0 means all income is equally distributed
- Gini Coefficient of 1 means all income is held by one person.
- Looks at the change in personal income between 2009 and 2014 and how that change in income is distributed across households.
How well Business and Education Indices Correlate with Economic Performance
Numerous indices purport to have some connection with how poised for economic growth a state is. Data from 2009 and the most recent rankings were included. The 2009 rankings were used since they coincided with the start of the shorter-term period since the end of our recession and the beginning of private sector job growth. 2016 rankings were the most recent. For this review some of the ones frequently cited were used:
- American Legislative Exchange Council (2009 and 2016 rankings)[2]
o ALEC’s Economic Outlook rankings are based on having top personal or corporate tax rates that are low, regressive income tax structures (if income goes up, tax burden going down is preferred), requiring that unionized workplaces be open (no one is required to join the union), low taxes overall, recent tax changes that reduce taxes, a low minimum wage, fewer state employees per 10,000 population, and expenditure controls on state government.
o Arizona has historically ranked very highly with ALEC. In 2009 Arizona ranked 3rd. In 2016 Arizona ranked 5th.
- Chief Executive Magazine (2009 and 2016 rankings)[3]
o Chief Executive Magazine completes an annual survey of 513 CEO’s to rank states based on the “friendliness of their tax and regulatory regime, workforce quality and living environment (This latter category includes not just the cost of living but the education system and the state and local attitudes toward business).”[4]
o Arizona has historically been ranked highly by Chief Executive Magazine. In 2009 Arizona ranked 8th. In 2016 Arizona ranked 6th.
- Forbes Best States for Business (2009 and 2015 rankings)[5]
o Forbes factors in 40 data points across six areas to determine their rankings.[6]
- Forbes most heavily weighs their business cost index which relies heavily but not exclusively on Moody’s Analytics Cost of Doing Business.
- Forbes’ other categories include labor supply which looks at educational attainment and net migration.
- The regulatory score is largely impacted by the “Freedom in the 50 States” Report of the Mercatus Center at George Mason University.
- Their economic climate portion focuses on changes in jobs, income (not clear if per capita or just growth in personal income generally), Gross State Product, and unemployment over the past five years.
- Growth prospects is based on Moody Analytics expectations for jobs, income and gross state product going forward, and
- Finally Quality of Life includes cost of living, public education test scores (may not be demographically adjusted), crime rates, average temperature, and cultural and recreational amenities.
o Arizona ranked 36th in 2009 and had risen to 23rd by 2015. In 2015 Arizona’s best areas were growth prospects (7th) and labor supply (15th). Its worst areas were quality of life (40th) and economic climate (34th).
- Tax Foundation (2010 and 2016 Business Tax Climate Rankings)[7]
o The tax foundation looks at over 100 tax variables across five areas: corporate, individual income, sales, property and unemployment insurance to determine their ranking.
o Arizona has done fair with the Tax Foundation. In 2010 Arizona ranked 28th and by 2016 Arizona was 24th.
To these business rankings five measures of educational outcomes were examined, four specific educational outcomes plus a combined educational outcome measure.
- 2005-2009 NAEP 8th grade free and reduced lunch-adjusted math and reading scores
o Includes 2005, 2007 and 2009, where a random selection of schools selected from each state designed to be representative.
o In 2009, 2005 cohort would be graduating from high school. In 2015, the 2007 cohort would include some graduating from college. This measure provided one indicator of school quality.
o Free and Reduced Lunch-adjusted students means that each state’s scores were split evenly between students on free and reduced lunch and those not qualifying for the program, so on that level all states were demographically identical. NAEP on line data does not enable more sophisticated controls for income and other aspects, e.g., ethnicity. The two sets of math and reading scores were then added for each year, then added across the three years of testing and the states ranked. To qualify for free and reduced lunch a student’s family must be no higher than 185 percent of the federal poverty line.
o Arizona ranks 41st.
- 2003-2009 High School Graduation Rates
o Uses Average Freshman Graduation Rate (AFGR). Takes the number of students receiving high school diplomas divided by the size of its freshman class four years earlier. [8]
o These students would be 18 to 24 in 2009 and 24 to 30 years old in 2015
o This is based on the percent of freshman graduating four years later as collected from the states and published by the National Center for Educational Statistics
o Arizona ranks 37th.
- 2012-2013 Economically-adjusted High School Graduation Rates
o Uses Adjusted Cohort Graduation Rate (ACGR). Under the guidelines of No Child Left Behind, the National Center for Educational Statistics has developed a new student tracking based system that tracks actual students who were freshman and what percent of them actually graduate in four years. The 2011 graduating year was the first year data became available.[9]
o NCES data includes “economically disadvantaged” students but No Child Left Behind gave the states the ability to define what that constituted. The Everybody Graduates Center in the School of Education at Johns Hopkins University beginning with its annual report in 2014 for the class of 2012 breaks down for each state the percent of students considered “low income” and “nonlow income.” It also uses NCES data to indicate what the graduation rate for each state was for “low income” and “nonlow income” students. The economically-adjusted graduation rates averages the low income and nonlow income graduation rates for each state across the two years and then ranks them to create an economically-adjusted high school graduation rate that gives each state equivalent demographics across these two categories. [10]
o Arizona ranked 40th.
- 2005-2012 percent change in adults 25-64 with an Associate degree or higher (years limited due to data availability)
o Certainly more people with higher levels of educational attainment correlate with higher incomes. This measure looks at data from the American Community Survey at the percentage change of prime working age adults 25-64 who have earned an Associate degree or higher. [11] This could reflect the impact of in-migration for higher quality jobs as well as improvement longer term residents’ educational credentials.
o Arizona ranks 42nd.
- Combined Education Measures
o Average ranking for states across the four education measures
o Average rankings for states across three of the education measures using only one of the two high school graduation measures, so that is not weighted stronger.
o Arizona ranked 45th in two and 49th in the other.
This study takes each of these rankings and correlates them with the Economic Performance ranking as well as two others: percent vote for Mitt Romney for President in 2012, and a state ranking from of the leading state public universities from 2016 NCAA Men’s Basketball.
 Percent Romney 2012 is designed to test if the ranking is more political than economic in nature. Many indices look to see whether or not particular policies are in place in a given state. These policies are more often advocated by Republicans, e.g., low corporate tax rates. Percent Romney 2012 correlates modestly with Economic Performance at .283 with a probability of being greater than zero of 95 percent.
Percent Romney 2012 is designed to test if the ranking is more political than economic in nature. March Madness 2016 is the final April RPI for NCAA men’s basketball teams. It was designed to see if any ranking better correlated with something that had nothing to do with economic performance.
|
 March Madness 2016 is the final April RPI for NCAA men’s basketball teams. The primary flagship state university was identified in each state based on conference prestige, and if conference was the same, the older or better recognized institution was used. Though in South Dakota, South Dakota State was chosen when the Univ. of South Dakota and South Dakota State looked similar, but South Dakota State simply had an extraordinarily good year for a lower conference team. Alaska does not have a division 1 men’s basketball team, so received a 50th ranking. The University of Arizona represented Arizona, the University of California-Berkeley represented California, and the University of Kansas represented Kansas to give a sense. Needless to say, March Madness 2016 was designed to see if any ranking better correlated with something that had nothing to do with economic performance.
Correlations range from -1 (perfectly negatively correlated) to +1 (perfectly positively correlated). To illustrate, among the 88 countries with a population of 10 million or more, there is a 0.72 correlation between the number of athletes sent to the Rio Olympics and the country’s Gross Domestic Product per person (or per capita). For instance, the Netherlands (pop. 14 million) has a per capita GDP of $49,200 and sent 237 athletes to Rio. Chile (pop. 17.5 million) has a per capita GDP of half as much $23,500 and sent 41 athletes, while Zambia (pop. 15 million) has a per capita GDP of $3,900 and sent only 7 athletes.[12] A country’s wealth may not be the only factor in the number of athletes sent, but it appears to be a significant one.
In this case we have two sets of rankings from best to worst, 1 to 50, and the question is whether a particular ranking correlates positively with economic performance.
The results are shown in Table 4. The bold numbers are the Pearson Correlation coefficients which range from -1 (perfectly negatively related) to +1 (perfectly positively related). However, one also needs to look at the significance, which is the probability that the relationship is in that direction (positive or negative) and not zero or the opposite direction. *** refers to the strongest relationship that is more than 99 percent likely to be in the direction found. ** refers to a very strong relationship that is at least 95 percent likely to be in the direction found. * refers to a fairly strong relationship that is at least 90 percent likely to be in the direction found. If any of the correlations met an asterisk threshold-then that index was noted as best predicting the particular indicator: March Madness, Romney Vote, and/or Economic Performance.
Table 4 shows that none of the business indices correlate with economic performance except the Forbes index—but all correlate with the Romney Vote and, unfortunately, even with March Madness. The ALEC and Chief Executive Magazine rankings have particularly strong correlations with the 2012 Romney vote and no correlation with Economic Performance. The Tax Foundation rankings shows a fairly similar pattern. These results are consistent with the findings of a 2014 W.P. Carey Study that also found state competitiveness rankings wanting. That study like this one found the ALEC Economic Outlook and Chief Exec. Magazine Survey indices had little economic validity. The more multi-faceted Forbes index performed better.[13]
Table 4
Predictive Accuracy of Measures
| Measure |
 MARCH MADNESSCorrelation with Men’s College Basketball State University RPI Ranking (e.g. Univ. of Ariz. for Arizona, U of Kansas for Kansas, U of Kentucky for Kentucky, etc. ), 1 to 50. MARCH MADNESSCorrelation with Men’s College Basketball State University RPI Ranking (e.g. Univ. of Ariz. for Arizona, U of Kansas for Kansas, U of Kentucky for Kentucky, etc. ), 1 to 50. |
 ROMNEY VOTECorrelation with states that had highest percentage voting Mitt Romney for President in 2012, 1 to 50. ROMNEY VOTECorrelation with states that had highest percentage voting Mitt Romney for President in 2012, 1 to 50. |
ECONOMIC PERFORMANCECorrelation with 4-Factor Ranking of 14 and 6 year growth in both real GDP per job and Per Capita Personal Income, Unemployment with Underemployment, and how equally growth is distributed, 1 to 50. |
BEST PREDICTS |
| ALEC 2009 Economic Outlook Ranking |
.283**(.047) |
.605***(.000) |
.003(.983) |
|
| ALEC 2016 Economic Outlook Ranking |
.273*(.055) |
.613***(.000) |
.098(.497) |
|
| Chief Exec. Magazine CEO Survey 2009 |
.202(.160) |
.476***(.000) |
-.035(.810) |
|
| Chief Exec. Magazine CEO Survey 2016 |
.251*(.079) |
.516***(.000) |
.016(.911) |
|
| Forbes Best Business Climate 2009 |
.212(.140) |
.274*(.054) |
.234*(.103) |
|
| Forbes Best Business Climate 2015 |
.308**(.030) |
.264*(.064) |
.284**(.046) |
|
| Tax Foundation Business Tax Climate 2010 |
-.048(.739) |
.354**(.012) |
.030(.834) |
|
| Tax Foundation Business Tax Climate 2016 |
.015(.916) |
.411***(.003) |
.060(.681) |
|
| 2005-2009 NAEP free and reduced lunch-adjusted 8th grade reading and math scores |
-.249(.081) |
-.041(.777) |
.409***(.003) |
|
| 2003-2009 Average High School Graduation Rate |
-.155(.283) |
-.059(.685) |
.571***(.000) |
|
| 2012-2013Economically-adjusted High School Graduation Rate |
.011(.942) |
.128(.381) |
.480***(.000) |
|
| 2005-2012 Percent Change in adults 25-64 with Associate degree or higher |
-.133(.358) |
.376***(.007) |
.406***(.003) |
|
| Measure |
MARCH MADNESSCorrelation with Men’s College Basketball State University RPI Ranking (e.g. Univ. of Ariz. for Arizona, U of Kansas for Kansas, U of Kentucky for Kentucky, etc. ), 1 to 50. |
ROMNEY VOTECorrelation with states that had highest percentage voting Mitt Romney for President in 2012, 1 to 50. |
ECONOMIC PERFORMANCECorrelation with 4-Factor Ranking of 14 and 6 year growth in both real GDP per job and Per Capita Personal Income, Unemployment with Underemployment, and how equally growth is distributed, 1 to 50. |
BEST PREDICTS |
| COMBINED EDUCATION MEASURES |
| All FourThree (High School, NAEP, Assoc. Degree)Three (High School Adj., NAEP, Assoc. Degree) |
-.202(.160) -.246(.085) -.173(.230) |
.130(.369).111(.445).220(.124) |
.610***(.000).598***(.000) .579***(.000)
|
|
In sharp contrast, the four individual educational measures plus the three combined educational outcome measures by far have the highest correlation with economic performance with the Associate degree measure also strongly correlating with the Romney Vote. Among business indices, generally the less focused an index was on tax policy, the more likely it was to correlate with the Economic Performance index, so the Forbes index correlated better than the other business climate indices. But that index also correlated with March Madness and the Romney Vote. All the business indices correlated well with the Romney Vote, and only the Tax Foundation avoided the ignominy of a March Madness correlation, but it also had zero correlation with Economic Performance.
The findings are robust as seven variations of the Economic Performance Index were developed to verify the strength of results. All seven education measures maintained their strong positive correlations for all seven variations of the Economic Performance index, while business indices repeated failed except for the Forbes Index for measures that emphasized growth in real Gross Domestic Product per Job or per capita real state Gross Domestic Product growth.[14]
So while you may wish to consult some of these business indices before filling out your NCAA Tournament bracket, if your interest is in economic performance, then improving educational outcomes correlates most strongly with results.
Economic Performance Index in Detail
Growth in Real State Gross Domestic Product per Job since last two recessions
The findings are robust as seven variations of the Economic Performance Index were developed to verify the strength of results.Education measures maintained their strong positive correlations in all seven.
|
Real Gross State Domestic Product captures the added value of all new goods and services produced in the state measured in inflation-adjusted dollars, so increases in output, not higher prices increase it. Those goods and services are produced by individual proprietors and those employed by others. So dividing it by total employment gives us an indicator of the economy’s productivity. Total jobs for the Bureau of Economic Analysis includes full-time and part-time work. It includes wage and salary jobs as well as sole proprietors and individual general partners. It excludes unpaid family workers and volunteers. By using 2001 and 2009 as starting years, similar points in the business cycle are used to evaluate a longer-term and shorter-term performance. The focus is on growth, not absolute values, so states with higher real GDP per job, such as Delaware, are not privileged. To create the ranking each state’s growth from 2001-2014 and 2009-2014 were averaged and the states were then ranked.
However, the benefits of real GDP need not stay in the state. Corporate profits, for instance, may go to entities and individuals outside the state. Much of the growth early in the expansion went to profits. Some states in Table 5 show negative growth during the time periods, largely due to the depth of the 2008-2009 downturn in those states and their relatively weak recovery.
Table 5
Growth in Real State Gross Domestic Product Per Job (2009 dollars)
|
|
|
|
|
2001-2014 |
2009-2014 |
Average of two |
|
| State |
2001 |
2009 |
2014 |
|
Growth |
Growth |
Growth |
Rank |
| United States |
$76,992 |
$82,189 |
$84,247 |
|
9.4% |
2.5% |
6.0% |
|
| Alabama |
63,666 |
67,979 |
70,254 |
|
10.3% |
3.3% |
6.8% |
23 |
| Alaska |
95,233 |
113,860 |
106,701 |
|
12.0% |
-6.3% |
2.9% |
39 |
| Arizona |
72,876 |
74,478 |
74,747 |
|
2.6% |
0.4% |
1.5% |
42 |
| Arkansas |
57,816 |
64,604 |
69,585 |
|
20.4% |
7.7% |
14.0% |
7 |
| California |
84,880 |
95,501 |
96,137 |
|
13.3% |
0.7% |
7.0% |
21 |
| Colorado |
75,398 |
78,846 |
80,765 |
|
7.1% |
2.4% |
4.8% |
32 |
| Connecticut |
98,853 |
103,093 |
101,463 |
|
2.6% |
-1.6% |
0.5% |
44 |
| Delaware |
102,206 |
107,209 |
106,161 |
|
3.9% |
-1.0% |
1.4% |
43 |
| Florida |
70,484 |
72,645 |
70,188 |
|
-0.4% |
-3.4% |
-1.9% |
48 |
| Georgia |
77,441 |
76,231 |
76,211 |
|
-1.6% |
0.0% |
-0.8% |
47 |
| Hawaii |
70,545 |
77,371 |
78,241 |
|
10.9% |
1.1% |
6.0% |
26 |
| Idaho |
56,560 |
60,963 |
62,126 |
|
9.8% |
1.9% |
5.9% |
28 |
| Illinois |
83,609 |
87,346 |
88,790 |
|
6.2% |
1.7% |
3.9% |
35 |
| Indiana |
68,813 |
74,691 |
78,785 |
|
14.5% |
5.5% |
10.0% |
11 |
| Iowa |
60,275 |
69,724 |
75,547 |
|
25.3% |
8.4% |
16.8% |
2 |
| Kansas |
61,262 |
67,338 |
69,769 |
|
13.9% |
3.6% |
8.7% |
14 |
| Kentucky |
63,632 |
67,060 |
70,373 |
|
10.6% |
4.9% |
7.8% |
19 |
| Louisiana |
77,766 |
82,716 |
78,248 |
|
0.6% |
-5.4% |
-2.4% |
49 |
| Maine |
59,686 |
62,581 |
62,030 |
|
3.9% |
-0.9% |
1.5% |
41 |
| Maryland |
81,172 |
90,032 |
91,275 |
|
12.4% |
1.4% |
6.9% |
22 |
| Massachusetts |
85,998 |
92,826 |
94,667 |
|
10.1% |
2.0% |
6.0% |
25 |
| Michigan |
74,335 |
72,847 |
76,642 |
|
3.1% |
5.2% |
4.2% |
33 |
| Minnesota |
71,333 |
75,804 |
81,294 |
|
14.0% |
7.2% |
10.6% |
9 |
| Mississippi |
56,685 |
61,546 |
60,996 |
|
7.6% |
-0.9% |
3.4% |
38 |
| Missouri |
67,386 |
70,669 |
71,682 |
|
6.4% |
1.4% |
3.9% |
36 |
| Montana |
52,404 |
57,577 |
61,757 |
|
17.8% |
7.3% |
12.6% |
8 |
| Nebraska |
62,367 |
70,965 |
77,125 |
|
23.7% |
8.7% |
16.2% |
5 |
| Nevada |
78,393 |
78,397 |
75,981 |
|
-3.1% |
-3.1% |
-3.1% |
50 |
| New Hampshire |
68,358 |
73,708 |
76,756 |
|
12.3% |
4.1% |
8.2% |
16 |
| New Jersey |
95,444 |
97,019 |
96,618 |
|
1.2% |
-0.4% |
0.4% |
45 |
| New Mexico |
71,769 |
76,947 |
78,705 |
|
9.7% |
2.3% |
6.0% |
27 |
| New York |
99,838 |
104,404 |
106,111 |
|
6.3% |
1.6% |
4.0% |
34 |
| North Carolina |
71,972 |
78,084 |
77,613 |
|
7.8% |
-0.6% |
3.6% |
37 |
| North Dakota |
51,952 |
65,965 |
85,587 |
|
64.7% |
29.7% |
47.2% |
1 |
| Ohio |
70,772 |
73,915 |
79,212 |
|
11.9% |
7.2% |
9.5% |
12 |
| Oklahoma |
60,700 |
66,846 |
74,075 |
|
22.0% |
10.8% |
16.4% |
4 |
| Oregon |
62,422 |
82,276 |
82,940 |
|
32.9% |
0.8% |
16.8% |
3 |
| Pennsylvania |
76,267 |
79,889 |
83,297 |
|
9.2% |
4.3% |
6.7% |
24 |
| Rhode Island |
76,052 |
81,719 |
83,247 |
|
9.5% |
1.9% |
5.7% |
29 |
| South Carolina |
65,593 |
67,860 |
67,988 |
|
3.7% |
0.2% |
1.9% |
40 |
| South Dakota |
54,839 |
65,812 |
68,493 |
|
24.9% |
4.1% |
14.5% |
6 |
| Tennessee |
65,725 |
69,745 |
72,809 |
|
10.8% |
4.4% |
7.6% |
20 |
| Texas |
78,893 |
82,169 |
88,961 |
|
12.8% |
8.3% |
10.5% |
10 |
| Utah |
64,728 |
70,288 |
71,137 |
|
9.9% |
1.2% |
5.6% |
30 |
| Vermont |
56,511 |
60,774 |
63,283 |
|
12.0% |
4.1% |
8.1% |
17 |
| Virginia |
78,599 |
85,772 |
86,154 |
|
9.6% |
0.4% |
5.0% |
31 |
| Washington |
83,081 |
91,978 |
94,706 |
|
14.0% |
3.0% |
8.5% |
15 |
| West Virginia |
65,953 |
70,386 |
73,557 |
|
11.5% |
4.5% |
8.0% |
18 |
| Wisconsin |
66,718 |
71,455 |
75,338 |
|
12.9% |
5.4% |
9.2% |
13 |
| Wyoming |
80,584 |
96,455 |
87,297 |
|
8.3% |
-9.5% |
-0.6% |
46 |
Source: Bureau of Economic Analysis
Growth in Per Capita Personal Income since last two recessions
Personal Income measures all incomes accruing to people who reside in the state. [15] However, not all of it is wages and salaries. About one-third of it is dividends, interest and rent (DIR) as well as transfer payments (e.g., Social Security). These passive income earning activities may not originate in the state. However, DIR and transfer payments are an important component of individual well-being.[16] Per capita state personal income is that income per person residing in the state. By using 2001 and 2009 as starting years, similar points in the business cycle are used to evaluate a longer-term and shorter-term performance. If the absolute value of state personal income were used, then states like Connecticut and Massachusetts, which are wealthier would rank at the top. However, growth in per capita state personal income allows each state to use its own starting points as the reference. So if as Arizona Republic columnist Rob Robb has argued Arizona has more kids and retirees and a lower labor force participation rate, when focusing on growth, Arizona is not at a disadvantage relative to Massachusetts. Likewise, even though rural areas have lower incomes than urban areas, when one focuses on growth, improvements in rural or urban areas can lead to higher per capita state personal income. When Arizona has 80 percent of the nation’s per capita personal income, if both grow by ten percent, the ratio is still 80 percent.
Impactful growth happens over time, so looking at longer term as well as shorter term performance enables a sense of the state’s economic fundamentals, giving a bit more weight to the shorter-term, but in a longer-term context. So as with real GDP per job growth, each state’s growth in per capital personal income from 2001-2015 was averaged with 2009-2015 and then the states were ranked.
While it’s true, as Arizona Republic columnist Rob Robb argues that a state’s per capita personal income masks how it is distributed, growth does give us one indicator of economic prosperity.[17] Likewise, the Heritage Institute’s Stephen Moore and Arizona Free Enterprise Club’s Scot Mussi, critiqued the measure because the cost of living varies across states.[18] However, unless the relative cost of living is changing, when one focuses on growth, differences in the cost of living are irrelevant. In addition since 2008, the Bureau of Economic Analysis has created a Regional Price Parity Index annually for each state (100=National Average). Arizona’s index in 2009 was 100.1, but by 2014 it had dropped to 96.4, indicating the cost of living had fallen compared to the country, so Arizona’s growth for 2009-2014 was upwardly adjusted from 14.7 percent ((39,060-34,063)/34,063) to 15.2 percent (14.7/.963) as seen in Table 6.
Table 6 shows results and rankings for the 50 states. The time period covered has been an especially strong one for energy producing states. Consequently, some of the highest performing but sparsely populated states had growing and prosperous energy sectors, especially, North Dakota, Wyoming, and Oklahoma. As the recent financial collapse from falling energy prices in Oklahoma has spotlighted, this may not correspond with their long-run prospects. Arizona’s performance ranks near the bottom. All figures are in current dollars, not adjusted for inflation, which is why growth figures are larger than in Table 5.
Table 6
Growth in Per Capita Personal Income (current dollars)
|
|
|
|
2009-2014 |
|
2001-2015 |
2009-2015 |
Average of two |
|
| State |
2001 |
2009 |
2015 |
RPPRatio |
|
Growth |
Growth |
Growth |
Rank |
| United States |
31,540 |
39,376 |
47,669 |
1.000 |
|
51.1% |
21.1% |
36.1% |
|
| Alabama |
25,569 |
33,027 |
38,965 |
1.003 |
|
52.4% |
17.9% |
35.2% |
31 |
| Alaska |
32,870 |
46,192 |
55,940 |
0.989 |
|
70.2% |
21.3% |
45.8% |
4 |
| Arizona |
27,220 |
34,063 |
39,060 |
0.963 |
|
43.5% |
15.2% |
29.4% |
47 |
| Arkansas |
23,873 |
31,629 |
39,107 |
1.010 |
|
63.8% |
23.4% |
43.6% |
7 |
| California |
34,091 |
41,588 |
52,651 |
0.996 |
|
54.4% |
26.7% |
40.6% |
11 |
| Colorado |
35,247 |
41,508 |
50,410 |
1.009 |
|
43.0% |
21.3% |
32.1% |
42 |
| Connecticut |
43,696 |
55,505 |
66,972 |
0.986 |
|
53.3% |
21.0% |
37.1% |
22 |
| Delaware |
33,994 |
41,633 |
47,662 |
0.987 |
|
40.2% |
14.7% |
27.4% |
49 |
| Florida |
30,574 |
37,479 |
44,101 |
0.991 |
|
44.2% |
17.8% |
31.0% |
45 |
| Georgia |
29,594 |
34,396 |
40,551 |
0.988 |
|
37.0% |
18.1% |
27.6% |
48 |
| Hawaii |
29,648 |
41,093 |
47,753 |
0.997 |
|
61.1% |
16.2% |
38.7% |
15 |
| Idaho |
26,075 |
31,392 |
37,509 |
0.985 |
|
43.9% |
19.8% |
31.8% |
44 |
| Illinois |
33,755 |
41,529 |
49,471 |
0.998 |
|
46.6% |
19.2% |
32.9% |
38 |
| Indiana |
28,652 |
33,588 |
40,998 |
1.000 |
|
43.1% |
22.1% |
32.6% |
39 |
| Iowa |
28,367 |
38,123 |
44,971 |
1.015 |
|
58.5% |
17.7% |
38.1% |
18 |
| Kansas |
29,789 |
38,889 |
45,876 |
1.012 |
|
54.0% |
17.7% |
35.9% |
28 |
| Kentucky |
25,733 |
32,251 |
38,989 |
1.000 |
|
51.5% |
20.9% |
36.2% |
26 |
| Louisiana |
25,121 |
36,348 |
43,252 |
1.000 |
|
72.2% |
19.0% |
45.6% |
5 |
| Maine |
28,279 |
36,586 |
42,077 |
0.990 |
|
48.8% |
15.2% |
32.0% |
43 |
| Maryland |
36,819 |
48,739 |
56,127 |
0.991 |
|
52.4% |
15.3% |
33.9% |
35 |
| Massachusetts |
39,774 |
50,296 |
61,032 |
0.992 |
|
53.4% |
21.5% |
37.5% |
19 |
| Michigan |
30,245 |
34,159 |
42,427 |
0.988 |
|
40.3% |
24.5% |
32.4% |
40 |
| Minnesota |
33,326 |
41,064 |
50,541 |
0.999 |
|
51.7% |
23.1% |
37.4% |
21 |
| Mississippi |
22,806 |
30,188 |
35,444 |
1.010 |
|
55.4% |
17.2% |
36.3% |
24 |
| Missouri |
28,794 |
36,306 |
42,752 |
1.017 |
|
48.5% |
17.5% |
33.0% |
37 |
| Montana |
24,751 |
33,627 |
41,280 |
0.997 |
|
66.8% |
22.8% |
44.8% |
6 |
| Nebraska |
30,178 |
39,226 |
48,006 |
1.011 |
|
59.1% |
22.1% |
40.6% |
10 |
| Nevada |
31,789 |
36,931 |
42,185 |
0.970 |
|
32.7% |
14.7% |
23.7% |
50 |
| New Hampshire |
35,147 |
43,936 |
54,817 |
0.989 |
|
56.0% |
25.0% |
40.5% |
12 |
| New Jersey |
40,227 |
50,300 |
59,782 |
1.011 |
|
48.6% |
18.7% |
33.6% |
36 |
| New Mexico |
25,264 |
32,293 |
38,457 |
1.006 |
|
52.2% |
19.0% |
35.6% |
30 |
| New York |
36,308 |
47,655 |
57,705 |
1.003 |
|
58.9% |
21.0% |
40.0% |
14 |
| North Carolina |
28,484 |
34,944 |
40,656 |
0.996 |
|
42.7% |
16.4% |
29.6% |
46 |
| North Dakota |
26,540 |
39,422 |
54,376 |
1.028 |
|
104.9% |
36.9% |
70.9% |
1 |
| Ohio |
29,418 |
35,530 |
43,478 |
1.000 |
|
47.8% |
22.4% |
35.1% |
32 |
| Oklahoma |
26,572 |
34,578 |
44,272 |
1.007 |
|
66.6% |
27.8% |
47.2% |
3 |
| Oregon |
29,342 |
35,390 |
42,974 |
1.001 |
|
46.5% |
21.4% |
33.9% |
34 |
| Pennsylvania |
31,524 |
40,785 |
49,180 |
1.000 |
|
56.0% |
20.6% |
38.3% |
16 |
| Rhode Island |
31,574 |
41,081 |
50,080 |
0.987 |
|
58.6% |
22.2% |
40.4% |
13 |
| South Carolina |
25,859 |
32,499 |
38,041 |
0.989 |
|
47.1% |
17.2% |
32.2% |
41 |
| South Dakota |
28,440 |
38,661 |
45,002 |
1.026 |
|
58.2% |
16.0% |
37.1% |
23 |
| Tennessee |
28,147 |
34,468 |
42,069 |
0.997 |
|
49.5% |
22.1% |
35.8% |
29 |
| Texas |
29,717 |
37,037 |
46,745 |
1.002 |
|
57.3% |
26.2% |
41.7% |
8 |
| Utah |
25,712 |
32,428 |
39,045 |
0.992 |
|
51.9% |
20.6% |
36.2% |
25 |
| Vermont |
29,968 |
39,268 |
47,864 |
1.006 |
|
59.7% |
21.8% |
40.7% |
9 |
| Virginia |
33,711 |
44,458 |
52,136 |
0.991 |
|
54.7% |
17.4% |
36.0% |
27 |
| Washington |
33,241 |
42,248 |
51,146 |
1.001 |
|
53.9% |
21.0% |
37.5% |
20 |
| West Virginia |
23,306 |
31,429 |
37,047 |
1.016 |
|
59.0% |
17.6% |
38.3% |
17 |
| Wisconsin |
30,473 |
38,320 |
45,617 |
1.005 |
|
49.7% |
18.9% |
34.3% |
33 |
| Wyoming |
30,736 |
43,153 |
55,303 |
1.001 |
|
79.9% |
28.1% |
54.0% |
2 |
Source: Bureau of Economic Analysis
Average of U3 and U6 Unemployment Rates
Rather than focus on the numerical number of jobs created, this study looks at the operation of the state-level labor market in meeting the demand and supply for workers. Newly created jobs may or may not employ currently unemployed state residents. Instead people may move into the state to fill those jobs. Consequently, the unemployment rate gives a better picture of whether the pace of job creation is adequate for a given state. Underperforming economic areas frequently suffer from chronically higher unemployment.
Six state unemployment rates tracked by the federal government are defined by the Bureau of Labor Statistics as follows:[19]
- U-1, persons unemployed 15 weeks or longer, as a percent of the civilian labor force;
- U-2, job losers and persons who completed temporary jobs, as a percent of the civilian labor force;
- U-3, total unemployed, as a percent of the civilian labor force (the definition used for the official unemployment rate-must have actively looked for work in the last month to be included);
- U-4, total unemployed plus discouraged workers, as a percent of the civilian labor force plus discouraged workers;
- U-5, total unemployed, plus discouraged workers, plus all other marginally attached workers, as a percent of the civilian labor force plus all marginally attached workers; and
- U-6, total unemployed, plus all marginally attached workers, plus total employed part time for economic reasons, as a percent of the civilian labor force plus all marginally attached workers, including discouraged workers.
U-3 is the conventional unemployment rate that is widely publicized each month. To be part of the labor force, if not currently employed, one needs to have actively looked for work in the past month. U-6 is the widest measure of the underutilization of potential workers. It includes those who would like to be employed but have become discouraged and did not actively look for work in the past month, but have held a job or looked for work in the past 12 months or since last being employed within the last 12 months. The marginally attached are also available for work and have looked for work in the past 12 months or since last being employed within the last 12 months. They are the wider subset that includes discouraged workers. In addition, some workers are employed part-time, but would like to be employed full-time. However, either cannot find full-time work or have obstacles preventing access to full-time employment (e.g., lack of childcare).
Given the depth of the last recession, which struck some states, including Arizona, much harder than others, using the latest year’s unemployment rates—the last three quarters of 2015 and first quarter of 2016—seems most appropriate. The country is now in the seventh year of a recovery—which should provide even the harder hit states ample time to recover. The results are illustrated in Table 7.
Unemployment rates reveal some of the states that had high per capita income growth, such as California, 4th in shorter-term, and Louisiana, 3rd in the longer-term, show significant labor market inefficiencies ranking 45th and 42nd in Table 7, respectively. Among states hit hard by the housing crisis, Florida comes closest seven years into the recovery of approaching the national average in unemployment. Arizona is 44th and Nevada 50th.
Table 7
State Unemployment Rates 2015 Q2 to 2016 Q1
|
Measure |
|
| State |
U-3 |
U-6 |
|
U-3 with U-6 Average |
Rank |
| United States |
5.1 |
10.1 |
|
7.6 |
|
| Alabama |
6.2 |
10.9 |
|
8.55 |
43 |
| Alaska |
6.5 |
12 |
|
9.25 |
47 |
| Arizona |
5.9 |
11.7 |
|
8.8 |
44 |
| Arkansas |
4.7 |
9 |
|
6.85 |
21 |
| California |
5.9 |
12 |
|
8.95 |
45 |
| Colorado |
3.5 |
7.5 |
|
5.5 |
6 |
| Connecticut |
5.6 |
10.7 |
|
8.15 |
33 |
| Delaware |
4.9 |
9.2 |
|
7.05 |
24 |
| Florida |
5.2 |
11 |
|
8.1 |
32 |
| Georgia |
5.7 |
11.2 |
|
8.45 |
39 |
| Hawaii |
3.5 |
9.1 |
|
6.3 |
11 |
| Idaho |
4.2 |
8.4 |
|
6.3 |
12 |
| Illinois |
6 |
11 |
|
8.5 |
41 |
| Indiana |
4.7 |
8.8 |
|
6.75 |
20 |
| Iowa |
3.8 |
6.9 |
|
5.35 |
5 |
| Kansas |
4.2 |
8 |
|
6.1 |
10 |
| Kentucky |
5.5 |
10.5 |
|
8 |
31 |
| Louisiana |
6.2 |
10.8 |
|
8.5 |
42 |
| Maine |
4 |
9.3 |
|
6.65 |
19 |
| Maryland |
5 |
8.8 |
|
6.9 |
22 |
| Massachusetts |
4.7 |
9.6 |
|
7.15 |
25 |
| Michigan |
5.2 |
11.2 |
|
8.2 |
34 |
| Minnesota |
3.7 |
8 |
|
5.85 |
8 |
| Mississippi |
6.3 |
11.6 |
|
8.95 |
46 |
| Missouri |
4.6 |
8.7 |
|
6.65 |
18 |
| Montana |
4.2 |
9 |
|
6.6 |
17 |
| Nebraska |
3.3 |
6.6 |
|
4.95 |
3 |
| Nevada |
6.5 |
13.4 |
|
9.95 |
50 |
| New Hampshire |
3.1 |
7.4 |
|
5.25 |
4 |
| New Jersey |
5.2 |
9.5 |
|
7.35 |
27 |
| New Mexico |
6.7 |
12.4 |
|
9.55 |
49 |
| New York |
5.1 |
10.2 |
|
7.65 |
28 |
| North Carolina |
5.8 |
11 |
|
8.4 |
38 |
| North Dakota |
2.8 |
5.3 |
|
4.05 |
1 |
| Ohio |
4.8 |
9.8 |
|
7.3 |
26 |
| Oklahoma |
4.6 |
8.3 |
|
6.45 |
15 |
| Oregon |
5.4 |
11.2 |
|
8.3 |
35 |
| Pennsylvania |
5.2 |
10.7 |
|
7.95 |
30 |
| Rhode Island |
5.7 |
11 |
|
8.35 |
37 |
| South Carolina |
5.7 |
11.2 |
|
8.45 |
40 |
| South Dakota |
2.9 |
5.4 |
|
4.15 |
2 |
| Tennessee |
5.2 |
10.2 |
|
7.7 |
29 |
| Texas |
4.4 |
8.3 |
|
6.35 |
13 |
| Utah |
3.6 |
7.7 |
|
5.65 |
7 |
| Vermont |
3.6 |
8.1 |
|
5.85 |
9 |
| Virginia |
4.2 |
9.7 |
|
6.95 |
23 |
| Washington |
5.7 |
10.9 |
|
8.3 |
36 |
| West Virginia |
6.8 |
11.9 |
|
9.35 |
48 |
| Wisconsin |
4.5 |
8.3 |
|
6.4 |
14 |
| Wyoming |
4.4 |
8.5 |
|
6.45 |
16 |
Source: Bureau of Labor Statistics
Gini Coefficient 2009-2014
The Gini Coefficient is a measure of economic inequality. As noted earlier, growth in neither state GDP nor personal income does not indicate its distribution. This particular recovery has been well-documented as favoring the top 1 percent.[20] Unemployment gives one sense of remaining inequality, but the Gini Coefficient is a better overall measure. A Gini Coefficient of 0 represents perfect equality and a coefficient of 1 is the greatest inequality possible.
Figure 4 illustrates how a Gini Coefficient is calculated. The distribution of income across households is captured by the Lorenz Curve. The x-axis captures the share of the population, starting with the lowest earning. The y-axis captures the share of total income by each segment of the population. If each segment earned the same, it would match the “Line of Equality” and A would equal zero.
Figure 4
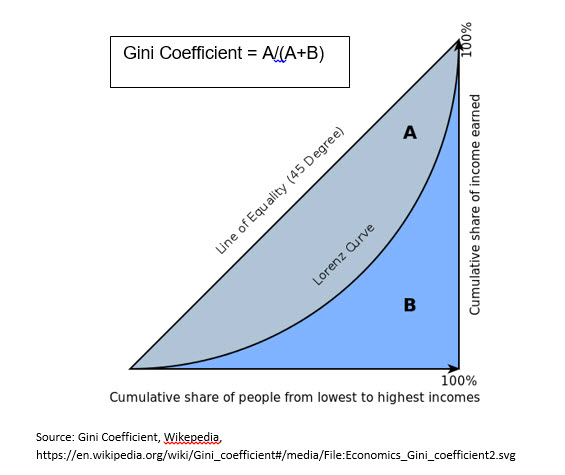
The Bureau of the Census uses household data from the annual American Community Survey to estimate Gini coefficient’s for individual states. Some states have far more inequality than others (e.g., New York and Connecticut). The objective is not to focus on absolute levels of inequality but to measure how changes in income have been distributed. Thus, a Gini Coefficient was calculated to determine given the level of growth in personal income in a state from 2009 to 2014, how the income would need to be distributed to account for the change in the Gini Coefficient from 2009 to 2014 (data for 2015 not yet available). This combined with the earlier measure of the growth of per capita personal income gives a more well-rounded sense of how well the growth has been distributed among a state’s residents.
Table 8 shows that the most equitable growth patterns occurred in West Virginia, Nebraska, and South Dakota while the least equitable growth was in Maine, Rhode Island, and Connecticut. Arizona also ranks among the least equitable growth states at 42nd place, while here is one place where Nevada outperforms Arizona considerably as the 15th lowest.
Table 8
Gini Coefficients for States 2009, 2014 and 2009-2014
| State |
2009 |
2014 |
2009-2014 Gini |
Rank |
| United States |
0.469 |
0.4804 |
0.533 |
|
| Alabama |
0.471 |
0.4758 |
0.506 |
20 |
| Alaska |
0.402 |
0.4175 |
0.484 |
8 |
| Arizona |
0.451 |
0.4676 |
0.559 |
42 |
| Arkansas |
0.461 |
0.4714 |
0.518 |
28 |
| California |
0.467 |
0.4890 |
0.573 |
43 |
| Colorado |
0.453 |
0.4584 |
0.479 |
7 |
| Connecticut |
0.480 |
0.5005 |
0.614 |
48 |
| Delaware |
0.434 |
0.4494 |
0.541 |
35 |
| Florida |
0.469 |
0.4834 |
0.550 |
38 |
| Georgia |
0.469 |
0.4801 |
0.539 |
32 |
| Hawaii |
0.425 |
0.4325 |
0.474 |
6 |
| Idaho |
0.421 |
0.4541 |
0.598 |
46 |
| Illinois |
0.469 |
0.4765 |
0.525 |
30 |
| Indiana |
0.434 |
0.4455 |
0.502 |
16 |
| Iowa |
0.431 |
0.4433 |
0.503 |
17 |
| Kansas |
0.444 |
0.4597 |
0.545 |
36 |
| Kentucky |
0.464 |
0.4704 |
0.505 |
19 |
| Louisiana |
0.473 |
0.4902 |
0.578 |
45 |
| Maine |
0.432 |
0.4593 |
0.699 |
50 |
| Maryland |
0.448 |
0.4491 |
0.456 |
4 |
| Massachusetts |
0.468 |
0.4863 |
0.574 |
44 |
| Michigan |
0.453 |
0.4598 |
0.495 |
13 |
| Minnesota |
0.439 |
0.4539 |
0.518 |
27 |
| Mississippi |
0.470 |
0.4760 |
0.515 |
23 |
| Missouri |
0.450 |
0.4628 |
0.540 |
34 |
| Montana |
0.431 |
0.4544 |
0.554 |
40 |
| Nebraska |
0.440 |
0.4352 |
0.417 |
2 |
| Nevada |
0.433 |
0.4427 |
0.501 |
15 |
| New Hampshire |
0.431 |
0.4410 |
0.488 |
12 |
| New Jersey |
0.465 |
0.4757 |
0.539 |
33 |
| New Mexico |
0.453 |
0.4770 |
0.613 |
47 |
| New York |
0.502 |
0.5111 |
0.558 |
41 |
| North Carolina |
0.464 |
0.4748 |
0.535 |
31 |
| North Dakota |
0.450 |
0.4664 |
0.495 |
14 |
| Ohio |
0.453 |
0.4637 |
0.518 |
29 |
| Oklahoma |
0.460 |
0.4660 |
0.485 |
11 |
| Oregon |
0.443 |
0.4624 |
0.553 |
39 |
| Pennsylvania |
0.460 |
0.4686 |
0.516 |
24 |
| Rhode Island |
0.457 |
0.4827 |
0.626 |
49 |
| South Carolina |
0.462 |
0.4687 |
0.504 |
18 |
| South Dakota |
0.452 |
0.4468 |
0.425 |
3 |
| Tennessee |
0.467 |
0.4811 |
0.545 |
37 |
| Texas |
0.474 |
0.4827 |
0.508 |
21 |
| Utah |
0.414 |
0.4283 |
0.484 |
9 |
| Vermont |
0.428 |
0.4406 |
0.508 |
22 |
| Virginia |
0.456 |
0.4658 |
0.517 |
26 |
| Washington |
0.439 |
0.4542 |
0.517 |
25 |
| West Virginia |
0.463 |
0.4546 |
0.399 |
1 |
| Wisconsin |
0.432 |
0.4397 |
0.485 |
10 |
| Wyoming |
0.415 |
0.4270 |
0.465 |
5 |
Source: Bureau of the Census, American Community Survey and calculations from change in personal income to derive 2009-2014l Gini by author. Bureau of Census state Gini coefficients found here http://factfinder.census.gov/faces/tableservices/jsf/pages/productview.xhtml?src=bkmk.
Putting these four factors (growth in real state Gross Domestic Product per job and state per capita Personal Income over 14 and 6 years, unemployment rate, and Gini Coefficient for 2009-2014) together, enables a ranking of the 50 states for their economic performance as shown in Table 9. Unfortunately, Arizona is the only state falling in the bottom ten for every measure, and, consequently is last. An earlier version of this study done six years ago that covered more prosperous times found Arizona ranked 34th, better, but still not a top performing state.[21]
Table 9
State Rank by Economic Performance Variable
| State |
GDP per Job 2001/2009-2014 |
PC PI 2001/2009-2015 |
Unemployment Rate |
Gini2009-2014 |
Avg. Rank |
ECONOMIC PERFORMANCE |
| Alabama |
23 |
31 |
43 |
20 |
29.25 |
30 |
| Alaska |
39 |
4 |
47 |
8 |
24.5 |
24 |
| Arizona |
42 |
47 |
44 |
42 |
43.75 |
50 |
| Arkansas |
7 |
7 |
21 |
28 |
15.75 |
10 |
| California |
21 |
11 |
45 |
43 |
30 |
32 |
| Colorado |
32 |
42 |
6 |
7 |
21.75 |
19 |
| Connecticut |
44 |
22 |
33 |
48 |
36.75 |
42 |
| Delaware |
43 |
49 |
24 |
35 |
37.75 |
43 |
| Florida |
48 |
45 |
32 |
38 |
40.75 |
47 |
| Georgia |
47 |
48 |
39 |
32 |
41.5 |
49 |
| Hawaii |
26 |
15 |
11 |
6 |
14.5 |
9 |
| Idaho |
28 |
44 |
12 |
46 |
32.5 |
36 |
| Illinois |
35 |
38 |
41 |
30 |
36 |
41 |
| Indiana |
11 |
39 |
20 |
16 |
21.5 |
18 |
| Iowa |
2 |
18 |
5 |
17 |
10.5 |
5 |
| Kansas |
14 |
28 |
10 |
36 |
22 |
20 |
| Kentucky |
19 |
26 |
31 |
19 |
23.75 |
22 |
| Louisiana |
49 |
5 |
42 |
45 |
35.25 |
39 |
| Maine |
41 |
43 |
19 |
50 |
38.25 |
45 |
| Maryland |
22 |
35 |
22 |
4 |
20.75 |
16 |
| Massachusetts |
25 |
19 |
25 |
44 |
28.25 |
28 |
| Michigan |
33 |
40 |
34 |
13 |
30 |
33 |
| Minnesota |
9 |
21 |
8 |
27 |
16.25 |
11 |
| Mississippi |
38 |
24 |
46 |
23 |
32.75 |
37 |
| Missouri |
36 |
37 |
18 |
34 |
31.25 |
34 |
| Montana |
8 |
6 |
17 |
40 |
17.75 |
14 |
| Nebraska |
5 |
10 |
3 |
2 |
5 |
2 |
| Nevada |
50 |
50 |
50 |
15 |
41.25 |
48 |
| New Hampshire |
16 |
12 |
4 |
12 |
11 |
6 |
| New Jersey |
45 |
36 |
27 |
33 |
35.25 |
39 |
| New Mexico |
27 |
30 |
49 |
47 |
38.25 |
45 |
| New York |
34 |
14 |
28 |
41 |
29.25 |
30 |
| North Carolina |
37 |
46 |
38 |
31 |
38 |
44 |
| North Dakota |
1 |
1 |
1 |
14 |
4.25 |
1 |
| Ohio |
12 |
32 |
26 |
29 |
24.75 |
25 |
| Oklahoma |
4 |
3 |
15 |
11 |
8.25 |
3 |
| Oregon |
3 |
34 |
35 |
39 |
27.75 |
27 |
| Pennsylvania |
24 |
16 |
30 |
24 |
23.5 |
21 |
| Rhode Island |
29 |
13 |
37 |
49 |
32 |
35 |
| South Carolina |
40 |
41 |
40 |
18 |
34.75 |
37 |
| South Dakota |
6 |
23 |
2 |
3 |
8.5 |
4 |
| Tennessee |
20 |
29 |
29 |
37 |
28.75 |
28 |
| Texas |
10 |
8 |
13 |
21 |
13 |
7 |
| Utah |
30 |
25 |
7 |
9 |
17.75 |
14 |
| Vermont |
17 |
9 |
9 |
22 |
14.25 |
8 |
| Virginia |
31 |
27 |
23 |
26 |
26.75 |
26 |
| Washington |
15 |
20 |
36 |
25 |
24 |
23 |
| West Virginia |
18 |
17 |
48 |
1 |
21 |
17 |
| Wisconsin |
13 |
33 |
14 |
10 |
17.5 |
13 |
| Wyoming |
46 |
2 |
16 |
5 |
17.25 |
12 |
|
|
|
|
|
|
|
|
Conclusion
While the economy is complex and evolving and policymakers seek to improve Arizona’s economic performance, it’s time to pivot from an economy that is focused primarily on increasing jobs and population to one that aims to improve the standard of living of the state’s residents.
For years Arizona has followed “business climate” ideologies, focused especially on tax structures, and prioritized reducing tax revenue over investments in its educational system.
If Arizona wants to improve its economic performance, educational investments are the best place to start.
|
However, when one looks at quality economic performance, Arizona falls far short of other states. Part of that is a consequence of the housing bubble and subsequent economic collapse that hit Arizona particularly hard, but even before that Arizona’s performance was middling, not stellar.
If Arizona wants to improve its economic performance, educational investments are the best place to start. Prop. 123 was an important first step in rectifying a near-decade of neglect, but the infusion of funds in Prop. 123 are primarily in resetting the base per student funding rate. Even for that the state is relying extensively on the School Trust Fund to find sufficient revenues. If Arizona wants to move from the bottom or middling states, it needs to explore how to make significant new investments in education, so as to boost the educational attainment of its residents.
Dave Wells holds a doctorate in Political Economy and Public Policy and is the Research Director for the Grand Canyon Institute, a centrist fiscal policy think tank founded in 2011. He can be reached at DWells@azgci.org or contact the Grand Canyon Institute at (602) 595-1025.
The Grand Canyon Institute, a 501(c) 3 nonprofit organization, is a centrist think tank led by a bipartisan group of former state lawmakers, economists, community leaders and academicians. The Grand Canyon Institute serves as an independent voice reflecting a pragmatic approach to addressing economic, fiscal, budgetary and taxation issues confronting Arizona.
Grand Canyon Institute
P.O. Box 1008
Phoenix, Arizona 85001-1008
GrandCanyonInsitute.org
Appendix (data used in the study)
| State |
Econ Performance |
% Romney |
March Madness |
ALEC 2009 |
ALEC 2016 |
Chief Exec 2009 |
Chief Exec 2016 |
| Alabama |
30 |
7 |
25 |
16 |
21 |
14 |
20 |
| Alaska |
24 |
18 |
50 |
38 |
25 |
5 |
30 |
| Arizona |
50 |
22 |
13 |
3 |
5 |
8 |
6 |
| Arkansas |
10 |
6 |
35 |
12 |
20 |
35 |
23 |
| California |
32 |
45 |
11 |
43 |
46 |
50 |
50 |
| Colorado |
19 |
31 |
19 |
2 |
16 |
10 |
15 |
| Connecticut |
42 |
40 |
14 |
32 |
47 |
38 |
46 |
| Delaware |
43 |
43 |
47 |
31 |
44 |
12 |
13 |
| Florida |
47 |
25 |
18 |
11 |
8 |
3 |
2 |
| Georgia |
49 |
23 |
21 |
8 |
19 |
4 |
8 |
| Hawaii |
9 |
50 |
23 |
41 |
42 |
41 |
44 |
| Idaho |
36 |
4 |
30 |
14 |
15 |
16 |
21 |
| Illinois |
41 |
41 |
39 |
44 |
43 |
45 |
48 |
| Indiana |
18 |
20 |
10 |
17 |
6 |
11 |
5 |
| Iowa |
5 |
30 |
12 |
35 |
29 |
19 |
17 |
| Kansas |
20 |
10 |
1 |
24 |
27 |
21 |
26 |
| Kentucky |
22 |
8 |
7 |
36 |
33 |
23 |
24 |
| Louisiana |
39 |
14 |
27 |
18 |
28 |
43 |
37 |
| Maine |
45 |
39 |
49 |
47 |
38 |
32 |
33 |
| Maryland |
16 |
46 |
9 |
28 |
31 |
31 |
43 |
| Massachusetts |
28 |
44 |
42 |
26 |
26 |
46 |
45 |
| Michigan |
33 |
35 |
20 |
34 |
22 |
48 |
40 |
| Minnesota |
11 |
34 |
46 |
40 |
45 |
33 |
34 |
| Mississippi |
37 |
17 |
29 |
19 |
17 |
30 |
42 |
| Missouri |
34 |
21 |
45 |
23 |
24 |
26 |
29 |
| Montana |
14 |
16 |
38 |
30 |
40 |
27 |
25 |
| Nebraska |
2 |
9 |
41 |
29 |
32 |
28 |
27 |
| Nevada |
48 |
33 |
28 |
7 |
14 |
6 |
9 |
| New Hampshire |
6 |
29 |
40 |
37 |
23 |
18 |
28 |
| New Jersey |
39 |
42 |
48 |
46 |
48 |
47 |
47 |
| New Mexico |
45 |
36 |
36 |
25 |
34 |
34 |
32 |
| New York |
30 |
48 |
31 |
50 |
50 |
49 |
49 |
| North Carolina |
44 |
24 |
4 |
21 |
2 |
2 |
3 |
| North Dakota |
1 |
12 |
44 |
13 |
3 |
17 |
22 |
| Ohio |
25 |
26 |
24 |
45 |
18 |
44 |
10 |
| Oklahoma |
3 |
3 |
5 |
15 |
10 |
22 |
18 |
| Oregon |
27 |
37 |
3 |
39 |
41 |
24 |
39 |
| Pennsylvania |
21 |
28 |
32 |
42 |
39 |
29 |
36 |
| Rhode Island |
35 |
47 |
33 |
48 |
35 |
39 |
41 |
| South Carolina |
37 |
19 |
22 |
20 |
30 |
9 |
7 |
| South Dakota |
4 |
13 |
17 |
5 |
11 |
13 |
19 |
| Tennessee |
28 |
11 |
37 |
9 |
7 |
5 |
4 |
| Texas |
7 |
15 |
15 |
10 |
12 |
1 |
1 |
| Utah |
14 |
1 |
6 |
1 |
1 |
15 |
16 |
| Vermont |
8 |
49 |
34 |
49 |
49 |
36 |
38 |
| Virginia |
26 |
27 |
2 |
4 |
13 |
7 |
12 |
| Washington |
23 |
38 |
26 |
22 |
36 |
40 |
31 |
| West Virginia |
17 |
5 |
8 |
33 |
37 |
37 |
35 |
| Wisconsin |
13 |
32 |
16 |
27 |
9 |
42 |
11 |
| Wyoming |
12 |
2 |
43 |
6 |
4 |
20 |
14 |
| State |
Econ Performance |
% Romney |
March Madness |
Forbes 2009 |
Forbes 2015 |
Tax Foundation 2010 |
Tax Foundation 2016 |
| Alabama |
30 |
7 |
25 |
28 |
45 |
19 |
29 |
| Alaska |
24 |
18 |
50 |
42 |
44 |
3 |
3 |
| Arizona |
50 |
22 |
13 |
36 |
23 |
28 |
24 |
| Arkansas |
10 |
6 |
35 |
26 |
35 |
40 |
38 |
| California |
32 |
45 |
11 |
38 |
32 |
48 |
48 |
| Colorado |
19 |
31 |
19 |
4 |
5 |
13 |
18 |
| Connecticut |
42 |
40 |
14 |
35 |
39 |
38 |
44 |
| Delaware |
43 |
43 |
47 |
21 |
17 |
8 |
14 |
| Florida |
47 |
25 |
18 |
18 |
20 |
5 |
4 |
| Georgia |
49 |
23 |
21 |
6 |
11 |
29 |
39 |
| Hawaii |
9 |
50 |
23 |
39 |
43 |
24 |
31 |
| Idaho |
36 |
4 |
30 |
11 |
22 |
18 |
19 |
| Illinois |
41 |
41 |
39 |
24 |
38 |
30 |
23 |
| Indiana |
18 |
20 |
10 |
30 |
8 |
12 |
8 |
| Iowa |
5 |
30 |
12 |
14 |
14 |
46 |
40 |
| Kansas |
20 |
10 |
1 |
15 |
21 |
32 |
22 |
| Kentucky |
22 |
8 |
7 |
43 |
28 |
20 |
28 |
| Louisiana |
39 |
14 |
27 |
44 |
40 |
35 |
37 |
| Maine |
45 |
39 |
49 |
41 |
48 |
34 |
34 |
| Maryland |
16 |
46 |
9 |
12 |
33 |
45 |
41 |
| Massachusetts |
28 |
44 |
42 |
34 |
18 |
36 |
25 |
| Michigan |
33 |
35 |
20 |
49 |
30 |
17 |
13 |
| Minnesota |
11 |
34 |
46 |
17 |
13 |
43 |
47 |
| Mississippi |
37 |
17 |
29 |
40 |
49 |
21 |
20 |
| Missouri |
34 |
21 |
45 |
29 |
26 |
16 |
17 |
| Montana |
14 |
16 |
38 |
13 |
24 |
6 |
6 |
| Nebraska |
2 |
9 |
41 |
9 |
3 |
33 |
27 |
| Nevada |
48 |
33 |
28 |
31 |
34 |
4 |
5 |
| New Hampshire |
6 |
29 |
40 |
19 |
37 |
7 |
7 |
| New Jersey |
39 |
42 |
48 |
45 |
41 |
50 |
50 |
| New Mexico |
45 |
36 |
36 |
27 |
47 |
23 |
35 |
| New York |
30 |
48 |
31 |
32 |
29 |
49 |
49 |
| North Carolina |
44 |
24 |
4 |
5 |
2 |
39 |
15 |
| North Dakota |
1 |
12 |
44 |
7 |
4 |
25 |
26 |
| Ohio |
25 |
26 |
24 |
37 |
15 |
47 |
42 |
| Oklahoma |
3 |
3 |
5 |
20 |
16 |
31 |
33 |
| Oregon |
27 |
37 |
3 |
10 |
12 |
14 |
11 |
| Pennsylvania |
21 |
28 |
32 |
33 |
36 |
27 |
32 |
| Rhode Island |
35 |
47 |
33 |
50 |
46 |
44 |
45 |
| South Carolina |
37 |
19 |
22 |
25 |
25 |
26 |
36 |
| South Dakota |
4 |
13 |
17 |
16 |
9 |
1 |
2 |
| Tennessee |
28 |
11 |
37 |
23 |
19 |
22 |
16 |
| Texas |
7 |
15 |
15 |
8 |
6 |
11 |
10 |
| Utah |
14 |
1 |
6 |
3 |
1 |
10 |
9 |
| Vermont |
8 |
49 |
34 |
47 |
42 |
41 |
46 |
| Virginia |
26 |
27 |
2 |
1 |
7 |
15 |
30 |
| Washington |
23 |
38 |
26 |
2 |
10 |
9 |
12 |
| West Virginia |
17 |
5 |
8 |
46 |
50 |
37 |
21 |
| Wisconsin |
13 |
32 |
16 |
48 |
31 |
42 |
43 |
| Wyoming |
12 |
2 |
43 |
22 |
27 |
2 |
1 |
| State |
Econ Performance |
% Romney |
March Madness |
NAEP |
High School |
High School (Economically adjusted) |
Assoc. or Higher |
| Alabama |
30 |
7 |
25 |
49 |
43 |
33 |
22 |
| Alaska |
24 |
18 |
50 |
35 |
41 |
47 |
15 |
| Arizona |
50 |
22 |
13 |
41 |
37 |
40 |
42 |
| Arkansas |
10 |
6 |
35 |
38 |
27 |
11 |
8 |
| California |
32 |
45 |
11 |
47 |
38 |
25 |
49 |
| Colorado |
19 |
31 |
19 |
24 |
26 |
43 |
27 |
| Connecticut |
42 |
40 |
14 |
33 |
14 |
20 |
43 |
| Delaware |
43 |
43 |
47 |
23 |
36 |
28 |
48 |
| Florida |
47 |
25 |
18 |
34 |
44 |
42 |
44 |
| Georgia |
49 |
23 |
21 |
37 |
47 |
46 |
39 |
| Hawaii |
9 |
50 |
23 |
50 |
31 |
22 |
38 |
| Idaho |
36 |
4 |
30 |
14 |
13 |
|
30 |
| Illinois |
41 |
41 |
39 |
31 |
19 |
24 |
25 |
| Indiana |
18 |
20 |
10 |
21 |
34 |
6 |
9 |
| Iowa |
5 |
30 |
12 |
20 |
3 |
3 |
1 |
| Kansas |
20 |
10 |
1 |
6 |
20 |
8 |
24 |
| Kentucky |
22 |
8 |
7 |
26 |
29 |
5 |
16 |
| Louisiana |
39 |
14 |
27 |
42 |
46 |
44 |
20 |
| Maine |
45 |
39 |
49 |
8 |
21 |
13 |
28 |
| Maryland |
16 |
46 |
9 |
29 |
16 |
21 |
33 |
| Massachusetts |
28 |
44 |
42 |
1 |
15 |
15 |
36 |
| Michigan |
33 |
35 |
20 |
39 |
32 |
39 |
40 |
| Minnesota |
11 |
34 |
46 |
7 |
4 |
41 |
10 |
| Mississippi |
37 |
17 |
29 |
46 |
48 |
37 |
32 |
| Missouri |
34 |
21 |
45 |
25 |
11 |
9 |
13 |
| Montana |
14 |
16 |
38 |
4 |
10 |
19 |
34 |
| Nebraska |
2 |
9 |
41 |
19 |
5 |
4 |
6 |
| Nevada |
48 |
33 |
28 |
48 |
50 |
49 |
35 |
| New Hampshire |
6 |
29 |
40 |
9 |
12 |
16 |
18 |
| New Jersey |
39 |
42 |
48 |
11 |
6 |
14 |
47 |
| New Mexico |
45 |
36 |
36 |
45 |
45 |
45 |
29 |
| New York |
30 |
48 |
31 |
15 |
42 |
36 |
31 |
| North Carolina |
44 |
24 |
4 |
28 |
39 |
27 |
26 |
| North Dakota |
1 |
12 |
44 |
3 |
7 |
17 |
3 |
| Ohio |
25 |
26 |
24 |
18 |
17 |
29 |
11 |
| Oklahoma |
3 |
3 |
5 |
36 |
23 |
12 |
50 |
| Oregon |
27 |
37 |
3 |
16 |
30 |
48 |
17 |
| Pennsylvania |
21 |
28 |
32 |
17 |
9 |
18 |
7 |
| Rhode Island |
35 |
47 |
33 |
43 |
24 |
30 |
46 |
| South Carolina |
37 |
19 |
22 |
30 |
49 |
34 |
12 |
| South Dakota |
4 |
13 |
17 |
5 |
8 |
32 |
45 |
| Tennessee |
28 |
11 |
37 |
40 |
40 |
2 |
5 |
| Texas |
7 |
15 |
15 |
13 |
33 |
1 |
41 |
| Utah |
14 |
1 |
6 |
32 |
18 |
31 |
14 |
| Vermont |
8 |
49 |
34 |
2 |
2 |
7 |
21 |
| Virginia |
26 |
27 |
2 |
22 |
22 |
26 |
19 |
| Washington |
23 |
38 |
26 |
12 |
35 |
35 |
37 |
| West Virginia |
17 |
5 |
8 |
44 |
25 |
23 |
23 |
| Wisconsin |
13 |
32 |
16 |
27 |
1 |
10 |
4 |
| Wyoming |
12 |
2 |
43 |
10 |
28 |
38 |
2 |
|
|
|
|
|
|
|
|
|
| State |
Econ Performance-Balanced |
% Romney |
March Madness |
Educ. CombinedAll 4 |
Educ. Combined3 with HS |
Educ. Combined3 with HS Adj |
| Alabama |
30 |
7 |
25 |
41 |
42 |
39 |
| Alaska |
24 |
18 |
50 |
38 |
33 |
36 |
| Arizona |
50 |
22 |
13 |
45 |
45 |
49 |
| Arkansas |
10 |
6 |
35 |
20 |
24 |
17 |
| California |
32 |
45 |
11 |
44 |
50 |
47 |
| Colorado |
19 |
31 |
19 |
32 |
26 |
34 |
| Connecticut |
42 |
40 |
14 |
28 |
32 |
35 |
| Delaware |
43 |
43 |
47 |
37 |
37 |
38 |
| Florida |
47 |
25 |
18 |
47 |
46 |
46 |
| Georgia |
49 |
23 |
21 |
49 |
47 |
48 |
| Hawaii |
9 |
50 |
23 |
39 |
43 |
41 |
| Idaho |
36 |
4 |
30 |
16 |
15 |
21 |
| Illinois |
41 |
41 |
39 |
26 |
25 |
25 |
| Indiana |
18 |
20 |
10 |
13 |
20 |
5 |
| Iowa |
5 |
30 |
12 |
1 |
3 |
2 |
| Kansas |
20 |
10 |
1 |
8 |
13 |
6 |
| Kentucky |
22 |
8 |
7 |
16 |
23 |
10 |
| Louisiana |
39 |
14 |
27 |
43 |
38 |
40 |
| Maine |
45 |
39 |
49 |
13 |
15 |
13 |
| Maryland |
16 |
46 |
9 |
26 |
27 |
31 |
| Massachusetts |
28 |
44 |
42 |
11 |
14 |
15 |
| Michigan |
33 |
35 |
20 |
42 |
40 |
43 |
| Minnesota |
11 |
34 |
46 |
10 |
2 |
19 |
| Mississippi |
37 |
17 |
29 |
46 |
48 |
42 |
| Missouri |
34 |
21 |
45 |
8 |
12 |
10 |
| Montana |
14 |
16 |
38 |
11 |
11 |
17 |
| Nebraska |
2 |
9 |
41 |
4 |
5 |
3 |
| Nevada |
48 |
33 |
28 |
50 |
49 |
50 |
| New Hampshire |
6 |
29 |
40 |
7 |
8 |
9 |
| New Jersey |
39 |
42 |
48 |
18 |
20 |
23 |
| New Mexico |
45 |
36 |
36 |
47 |
43 |
44 |
| New York |
30 |
48 |
31 |
35 |
31 |
29 |
| North Carolina |
44 |
24 |
4 |
32 |
36 |
27 |
| North Dakota |
1 |
12 |
44 |
2 |
1 |
1 |
| Ohio |
25 |
26 |
24 |
15 |
10 |
19 |
| Oklahoma |
3 |
3 |
5 |
34 |
39 |
37 |
| Oregon |
27 |
37 |
3 |
29 |
18 |
27 |
| Pennsylvania |
21 |
28 |
32 |
6 |
7 |
8 |
| Rhode Island |
35 |
47 |
33 |
40 |
41 |
44 |
| South Carolina |
37 |
19 |
22 |
36 |
33 |
24 |
| South Dakota |
4 |
13 |
17 |
24 |
17 |
29 |
| Tennessee |
28 |
11 |
37 |
21 |
29 |
10 |
| Texas |
7 |
15 |
15 |
22 |
30 |
16 |
| Utah |
14 |
1 |
6 |
25 |
20 |
25 |
| Vermont |
8 |
49 |
34 |
3 |
4 |
4 |
| Virginia |
26 |
27 |
2 |
23 |
18 |
22 |
| Washington |
23 |
38 |
26 |
31 |
28 |
32 |
| West Virginia |
17 |
5 |
8 |
30 |
35 |
33 |
| Wisconsin |
13 |
32 |
16 |
5 |
6 |
7 |
| Wyoming |
12 |
2 |
43 |
18 |
9 |
14 |
[1] Coor, Lattie and Sandra Watson (2016), “Our Turn: How Arizona can do better on jobs,” Arizona Republic, July 1, http://www.azcentral.com/story/opinion/op-ed/2016/07/01/arizona-jobs/86338762/ (accessed July 13, 2016).
[1] Robb, Robert (2016), “We’re measuring Arizona’s economy all wrong,“ Arizona Republic, July 8, http://www.azcentral.com/story/opinion/op-ed/robertrobb/2016/07/08/arizona-economy/86823574/ (accessed July 13, 2016).
[1] Moore, Stephen and Scot Mussi (2016), “Our Turn: Arizona jobs report wrong—we’re better than this,” Arizona Republic, July 18, http://www.azcentral.com/story/opinion/op-ed/2016/07/18/arizona-job-creation-progress-wrong/86954452/ (accessed July 20, 2016).
[2] The American Legislative Exchange Council’s reports “Rich States, Poor States,” began in 2007. The 2009 (2nd edition) and 2016 (9th edition) can be accessed at their website https://www.alec.org/periodical/rich-states/ (accessed July 23, 2016).
[3] “2016 Best and Worst States for Business,” http://chiefexecutive.net/2016-best-and-worst-states-for-business-full-list/ (accessed July 23, 2016). The 2009 list is no longer publicly accessible on line, but can be found in an earlier version of this study: Wells, David (2010), “Corporate Tax Games: March to Madness or Economic Growth?” March 31, http://www.public.asu.edu/~wellsda/research/Corporate_Tax_Games.pdf (accessed August 9, 2016).
[4] “2016 Best and Worst States for Business” (2016), Chief Executive Magazine, May 11, http://chiefexecutive.net/why-do-some-areas-of-the-country-thrive-while-others-see-businesses-atrophy-and-people-flee-at-alarming-rates/, accessed July 23, 2016.
[5][5] “Best States for Business” (2015), Forbes Magazine, http://www.forbes.com/best-states-for-business/list/2/#tab:overall. For the 2009 list see Wells, David (2010), “Corporate Tax Games: March to Madness or Economic Growth?” March 31, http://www.public.asu.edu/~wellsda/research/Corporate_Tax_Games.pdf (accessed August 9, 2016).
[6] Badenhausen, Kurt (2015), “Ranking the Best States for Business 2015: Behind the Numbers,” Forbes Magazine, Oct. 21, http://www.forbes.com/sites/kurtbadenhausen/2015/10/21/ranking-the-best-states-for-business-2015-behind-the-numbers/#8f1966e228e3 (accessed July 25, 2016).
[7] Walczak, Jared, Scott Drenkard, and Joseph Henchman (2015), “2016 Business Tax Climate Index,” Tax Foundation, Nov. 17, http://taxfoundation.org/article/2016-state-business-tax-climate-index (accessed July 23, 2016). The 2010 list can be accessed at Wells, David (2010), “Corporate Tax Games: March to Madness or Economic Growth?” March 31, http://www.public.asu.edu/~wellsda/research/Corporate_Tax_Games.pdf (accessed August 9, 2016).
[8] The AFGR is less precise than the ACGR. However, each has their advantages. The AFGR goes back decades and if the biases within it are relatively consistent, then changes in the AFGR measure meaningful outcomes. But the AFGR does not account for in state and out of state migration. So if more high schoolers are moving into Arizona, the AFGR could be biased upward. Likewise, if more are departing during their high school years, it would be biased downward. Likewise, it’s not a four-year graduation rate, as some students take more than four years to graduate. If the portion of them is relatively consistent, then the AFGR is not impacted, but if there is a surge or dearth of them from one year to the next, the AFGR would be impacted.
[9] The ACGR is a strict four-year on time graduation rate, tracking specific students, making it more precise than the AFGR. It accounts for in-migration, out-migration and student deaths. Consequently, it is a more accurate statistic overall though will omit students taking more than four years to graduate. The 2011 graduating class was the first year it was made publicly available, and even then, three states (Idaho, Kentucky, and Oklahoma) were not yet able to collect the needed data. By 2014 only Idaho was not yet collecting the necessary data. For discussion see McFarland, Joel (2016), “What is the difference between ACGR and AFGR?” NCES Blog, National Center for Educational Statistics, Feb. 2, http://nces.ed.gov/blogs/nces/post/what-is-the-difference-between-the-acgr-and-the-afgr (accessed Aug. 9, 2016).
[10] Everybody Graduates Center’s Building a Grad Nation annual reports accessible at their web site. 2016 report (covering class of 2014) available here http://new.every1graduates.org/2016-building-a-grad-nation-report/. Earlier reports available here http://new.every1graduates.org/building-a-grad-nation-2016/building-a-grad-nation-state-profiles-and-annual-updates/ (accessed Aug. 9, 2016).
[11] Data downloaded from National Center for Higher Education Management Systems, “Generate Your Own Data,” http://www.higheredinfo.org/gyod/ (accessed July 26, 2016).
[12] Data on country GDP per capita is based on Purchasing Power Parity (PPP) as opposed to the exchange rate, so currency adjustments are to U.S. dollars on the basis of what it would purchase equivalently. Data comes from the Central Intelligence Agency World Fact Book. Data on the number of Olympic Athletes per country comes from “2016 Summer Olympics Participating Countries,” Maps of the World, http://www.mapsofworld.com/sports/olympics/summer-olympics/participating-nations.html (accessed August 6, 2016).
[13] Rex, Tom (2014), “Overview of Economic Competitiveness: Business and Individual Location Factors, with a focus on Arizona,” Center for Competitiveness and Prosperity Research, L. William Seidman Research Institute, W.P. Carey School of Business, Arizona State University, November, pp. 42-55, The Tax Foundation is also looked at in that report in the tax section, but not evaluated like other indices. https://wpcarey.asu.edu/sites/default/files/competitiveness11-14.pdf (accessed August 15, 2016).
[14] The six other formulations of Economic Performance were tested to verify the strength of results. They used the format of the one in the main paper, but one substituted per capita real GDP growth instead of GDP per job growth (all education measures positively correlated and Forbes 2015 just reached statistical significance), one without Gross Domestic Product but had two state rankings for per capita State Personal Income Growth 2001-2015 and 2009-2015 (only education measures statistically significant), one that omitted per capita State Personal Income Growth and instead had two state rankings for per capita real State Gross Domestic Product Growth 2001-2015 and 2009-2015 (Forbes 2015 index and education measures had statistically significant positive correlations), a six factor index that replaced the averages in the index used in this paper with two state rankings 2001-2015 and 2009-2015 for both per capita real State Gross Domestic Product Growth and per capita State Personal Income Growth (only the education measures had strong positive correlations). The other two used the six factor model using GDP per job growth instead of per capita GDP (only education measures positively correlated), and a four-factor model that used GDP per job from 2001-2014, 2009-2014, unemployment and the Gini Coefficient (both Forbes indices were statistically significant and positive, all education measures were positive).
[15] One explanation of the differences between GDP and Personal Income can be found at Shafrin, Jason (2011), “What is the difference between GNP, GDP, and National Income,” Healthcare Economist, March 23, http://healthcare-economist.com/2011/03/23/what-is-the-difference-between-gdp-gnp-and-national-income/ (accessed August 7, 2016).
[16] Harrah, Janet, “The Importance of Non-Earned Income to the Cincinnati MSA Economy,” The Community Research Collaborative Blog (no date indicated-latest data referenced is 2008), http://crcblog.typepad.com/crcblog/the-importance-of-non-earned-income-to-the-cincinnati-msa-economy.html (accessed August 15, 2016).
[17] Robb, Robert (2016), “We’re measuring Arizona’s economy all wrong,“ Arizona Republic, July 8, http://www.azcentral.com/story/opinion/op-ed/robertrobb/2016/07/08/arizona-economy/86823574/ (accessed July 13, 2016).
[18] Moore, Stephen and Scot Mussi (2016), “Our Turn: Arizona jobs report wrong—we’re better than this,” Arizona Republic, July 18, http://www.azcentral.com/story/opinion/op-ed/2016/07/18/arizona-job-creation-progress-wrong/86954452/ (accessed July 20, 2016).
[19] Bureau of Labor Statistics (2016), “Alternative Measures of Labor Underutilization for States,” http://www.bls.gov/lau/stalt.htm (accessed July 26, 2016).
[20] Saez, Emmanuel (2016), “U.S. Top 1 Percent of Income Earners Hit New High in 2015 Amid Strong Economic Growth,” Washington Center for Equitable Growth, July 3, http://equitablegrowth.org/research-analysis/u-s-top-one-percent-of-income-earners-hit-new-high-in-2015-amid-strong-economic-growth/ (accessed August 15, 2016).
[21] Wells, David (2010), “Corporate Tax Games: March to Madness or Economic Growth?” March 31, http://www.public.asu.edu/~wellsda/research/Corporate_Tax_Games.pdf (accessed August 9, 2016).
 Budget