Policy Paper
January 8, 2018
State of the State Budget 2018:
The Revenue System is Broken
Dave Wells, Research Director
Executive Summary
Governor Doug Ducey will introduce yet another austerity budget that is in deficit without calling it so on Monday, January 8. The Joint Legislative Budget Committee (JLBC) reports that the state has a net deficit a year after it increased spending by less than inflation plus population growth. The state’s revenue system is broken. A prime culprit has been the failure of the 2011 “Jobs Bill” (HB2001) which put forward a series of corporate tax reductions amounting to more than half a billion dollars each year by FY2018. Analysis of the New Employment Tax Credit portion of that legislation shows significant shortfalls in the state’s economic performance compared to anticipated growth rates. Arizona’s employment growth from 2010-2017 has resulted in 70,000 less jobs than the average growth rate of neighboring states of California, Nevada and Colorado applied to Arizona (high state-Utah and low state-New Mexico excluded). Consequently, no evidence supports claims that the Jobs Bill helped spur the state’s recovery
However, the large cost of the Jobs Bill has had fiscal consequences. State revenue growth in Arizona during the current expansion has lagged significantly behind all neighboring states except New Mexico. If the temporary revenue gains of the one cent three-year sales tax of Prop. 100 are removed then Arizona has fallen short of inflation, much less population growth.
Compared to FY2007 after adjusting for population growth, inflation, and continued use of accounting maneuvers, Arizona faces nearly a $5 billion deficit relative to state revenue at that time. Effectively, the state has about $3 for every $4 it had in FY2007 when adjusting for both inflation and population growth.
Given the state’s modest growth, the fiscal consequences of the Jobs Bill legislation on top of $4 billion in prior tax cuts since 1994 and more than half a billion dollars in tax credits is a state that is unable to meet its statutory and constitutional obligations.
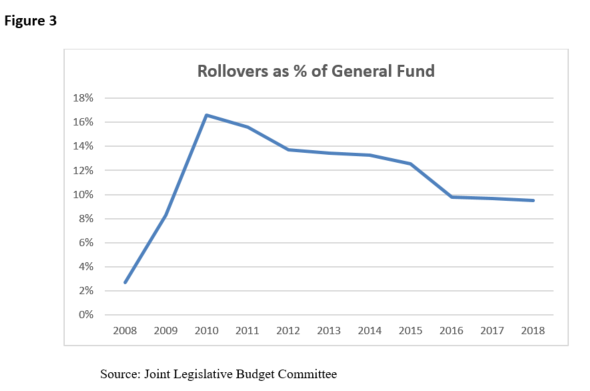
While the budget is claimed to be in balance, the JLBC indicates a net deficit for this year that becomes far worse once one-time spending is added. In addition, for a decade the state has rolled over its final K-12 payment to the next fiscal year, an amount that is twice the budget stabilization fund balance ($930 million compared to $460 million). This portion of expenditures being rolled over, nearly 10 percent, is about three times greater than at the end of the last expansion. The lack of revenue resources means the state will likely enter the next recession with this rollover still on the books.
Funding Shortfalls:
1) Prop. 123 has helped address the legislature’s violation of base education funding that led to a lawsuit, but the state continues to shortchange K-12 education in building and renewal funds and soft capital. Consequently, school districts have filed a lawsuit against the legislature for violating the Roosevelt v. Bishop case, which declared Arizona’s system of school capital finance unconstitutional. The legislature can fight providing sufficient resources to public education, but, ultimately, they will likely be found violating the state constitution. This will require about $750 million above current K-12 funding. Restoring all-day Kindergarten raises the total to $! billion. This ought to be a top priority for the legislature in this session.
2) In the past decade, per student funding to universities has been cut by more than half. The state’s high school graduation rate is below the national average and its overall college attainment rate for adults 25-64 is also below the national average. The Arizona Board of Regents has called on the state to commit to funding half the cost of Arizona resident undergraduate education. To do so would cost the state about $240 million.
3) The number of children in foster care appears to have peaked, but it is still far higher than it was a decade ago. The recent decrease may be more due to lower unemployment than anything the agency has accomplished. Turnover rates for specialists who work closely with vulnerable children and families remains very high, nearly 40 percent per year. Raising starting pay and reducing workloads should be a top priority but is impossible to do when the state lacks the revenues to do so. Investments in this critical area can help boost high school graduation rates, reduce crime, reduce future use of welfare and social services, and improve income equality. $15 million would raise the salaries of specialists by $10,000, a first step before then engaging in reducing caseloads by hiring additional specialists.
Improving Use of Resources:
1) Eliminate or cap private school tax credits. Tax credits now take up more than half a billion dollars of state revenue. One of the largest areas has been to subsidize private school enrollment which in FY2017 amounted to $150 million. Despite a significant increase in taxpayer funds, private school enrollment over the last 20 years has been flat. In 2016, the Grand Canyon Institute estimated that these tax credit programs (excluding those for students with disabilities) cost the state around $10,000 from the General Fund for each new private school student who would not have otherwise enrolled. This amount far exceeds the amount allocated from the General Fund per student to public schools. In 2018 a new census of private school enrollment will be published at which time the Grand Canyon Institute will update its estimate. The last legislative session saw another attempt to expand public monies to private schools. Unless the legislature repeals this legislation, voters will have the final word in a referendum in November 2018.
2) Perhaps around $50 million could be better allocated if Charter Schools were subject to procurement laws. Charter Schools receive more than $1 billion a year from the General Fund. Every charter school is fully funded by the General Fund as compared to public district schools which, depending on their local property-base, receive funding from the General Fund and/or local property taxes. Charter school enrollment has continued to grow compared to district schools which places additional pressure on the state General Fund. However, the state laws on charter school finances are quite lax, allowing three-quarters of charter school operators to engage in questionable financial transactions with related-parties (usually the charter holder’s own for-profit business) to provide school services outside of the competitive procurement process required of district schools. To provide better financial accountability and assure better returns to tax dollars, the legislature needs to subject charter schools to a similar procurement requirement. If lack of oversight is leading to expenditures being 10 percent too high, about $50 million could be better allocated to improve student achievement.
3) $80 million could be raised by improving tax code enforcement. The state claims to now have 11 corporate auditors, up from 4 in October of 2016, but down from 30 in May of 2016. Overall audit income fell by $80 million from FY2016 to FY2017. This outcome was predicted by experts, including the Grand Canyon Institute, yet budget amendments proposed to add auditors were voted down by the legislature. Will the legislature continue to allow a few corporations to avoid paying their legally obliged share of taxes?
4) $55 million could be saved by moving to an Earned Release system for nonviolent offenders who are incarcerated. Arizona, while making some small efforts to reduce recidivism, continues to be the only state in the country to require all nonviolent offenders to serve 85 percent of their sentence behind bars regardless of behavior. In 2012, the Grand Canyon Institute recommended transitioning to an earned release program that would maintain public safety. This enables inmates who comply with their program for rehabilitation to be released earlier into community supervision and frees up more resources to make sure they have treatment for drug issues which often contribute to recidivism.
Contents
Executive Summary 1
The State of the State Budget: Insufficient Revenues 5
The Almost Five Billion Dollar State Budget Deficit Compared to FY2007 5
Arizona’s Jobs Bill Costs the State Half a Billion Dollars Annually and Delivers No Jobs 8
Arizona’s Job and Revenue Performance Lags Behind Neighboring States 11
State of the State Budget: Key Funding Shortfalls 13
One Billion Dollar K-12 Education Funding Shortfall Despite Prop. 123 13
$233 million to Meet ABOR model after Per Pupil Funding Cut in Half 14
$15 million Initially to address Continued Challenges in Child Protection 16
State of the State Budget: Improving Allocations 17
Applying Public Procurement Procedures to Charter Schools 17
Up to $150 million: Capping or Eliminating Private School Tax Credits 18
$80 million: Enhance Audit Staffing in the Arizona Department of Revenue 20
$55 Million: Move to Earned Release for Nonviolent Offenders 22
The Grand Canyon Institute, a 501(c) 3 nonprofit organization, is a centrist think tank led by a bipartisan group of former state lawmakers, economists, community leaders and academicians. The Grand Canyon Institute serves as an independent voice reflecting a pragmatic approach to addressing economic, fiscal, budgetary and taxation issues confronting Arizona.
Grand Canyon Institute
P.O. Box 1008
Phoenix, Arizona 85001-1008
GrandCanyonInsitute.org
The State of the State Budget: Insufficient Revenues
The Almost Five Billion Dollar State Budget Deficit Compared to FY2007
Fiscal conservatives have long argued that the measuring rod of fiscal discipline is inflation plus population growth. Critics contend the appropriate measure is government spending as a portion of economic activity (Personal Income) that should be maintained.
By either measure the 2008-2010 economic downturn had significant negative ramifications on state finances. The state only got through that time period thanks to federal stimulus dollars and then survived through the end of FY2013 thanks to a temporary 1 cent sales tax which brought in nearly a billion dollars annually.
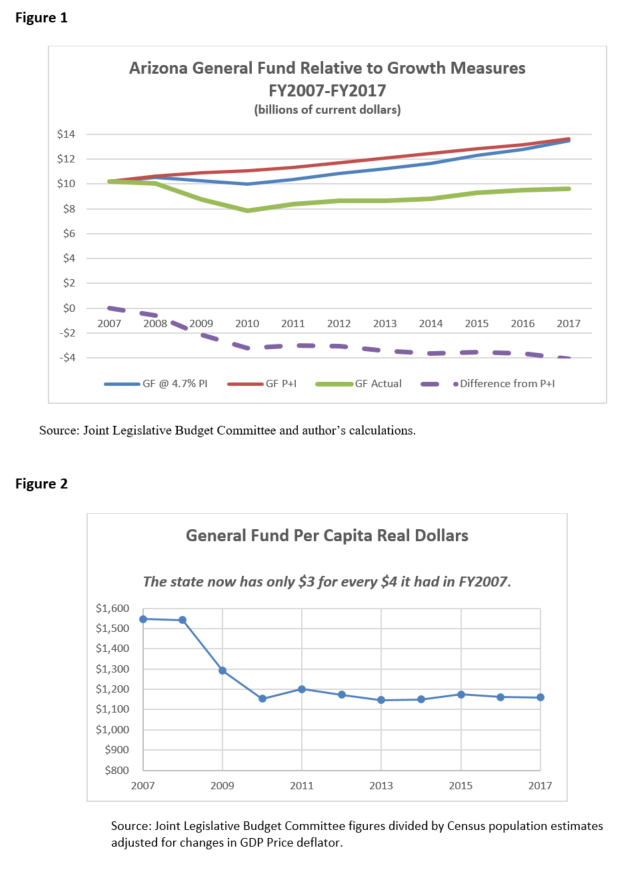
Using the most recent high point in government expenditure is FY2007 when state spending was 4.7 percent of state personal income, the highest in that decade but not unusual for the period before that. If the conservative measure is applied, then FY2018 state spending would have to increase by $4 billion or 40 percent to reach the population plus inflation yardstick. This decline has happened within the span of a decade. In fact, due to the significant economic downturn and the state’s modest economic recovery from it, the population plus inflation adjustment is actually higher than the 4.7 percent of Personal Income one during most of the last decade. See Figure 1. The depth of this reduction is why the state could so ill-afford to reduce revenues through the corporate tax reductions in the Jobs Bill.
Ironically, this $4 billion gap roughly equals the amount that taxes have been reduced since 1994. State employees have not been receiving raises—though some publicized executive appointed positions have during this time period.
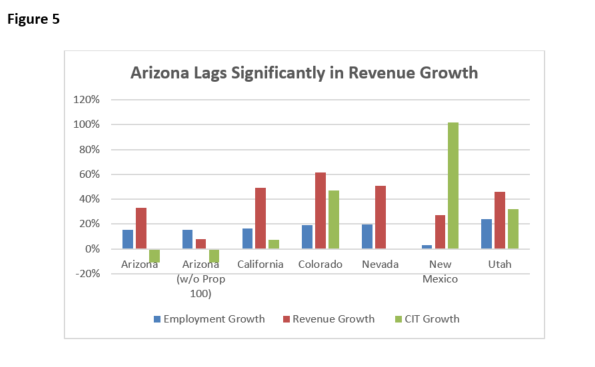
Last year Gov. Ducey’s executive budget proposal boasted that his FY2018 budget would increase expenditures by less than population plus inflation, so the gap has continued to widen. The consequence is that today the state has approximately $3 for every $4 it had in FY2007. See Figure 2. That is worse than any other state in the region because Nevada and Arizona were both hit the hardest by the downturn, yet Nevada’s revenues have increased nearly twice as much as Arizona’s and Nevada has had a stronger employment rebound than Arizona (see Figure 5).
Figure 1 and Figure 2
With dollars extremely tight, the state has been unable to allocate funds to eliminate rollovers, so continues the $930 million K-12 rollover whereby the last payment of the past fiscal year is rolled over into the next one. This rollover represents 9.5 percent of the General Fund expenditures, more than three times as large as the use of rollovers in FY2008. Tight fiscal conditions and the little political benefit to using scarce resources to reduce this rollover means the state will likely carry this rollover into the next recession. The rollover is twice as large as the budget stabilization fund of $460 million—and consequently hides a significant ongoing deficit. See Figure 3.
Figure 3
When Figures 1 and 3 are combined, rather than running a balanced budget (which is actually falling out of balance), Arizona relative to its performance in FY2007, is running a deficit of approaching $5 billion, $1 billion in rollovers and $4 billion in lost revenue not recovered since FY2007—half of the entire General Fund. Technically, the amount is just under $5 billion since $273 million dollars in rollovers were still on the books entering FY2008.
Consequently, pressures to increase expenditures are growing and even ideological folks dedicated to cutting taxes now do so largely more symbolically so they can, as the Governor insists, say they reduced taxes every year.
Arizona’s Jobs Bill Costs the State Half a Billion Dollars Annually and Delivers No Jobs
In 2011 after 3 days of debate, the legislature passed a series of corporate tax breaks that proponents said would spur the economy. Examination of both the New Jobs Credit that was contained in the legislation as well as comparing Arizona’s performance since 2010 with neighboring states yields the same conclusion — the Jobs Bill has been a failure and one of the key reasons Arizona’s budgets remain in a perpetual state of fiscal austerity.
The 2011 legislation gradually reduced various taxes, most notably the corporate income tax rate over time from FY2012 through FY2018, so it is now fully phased in. Within that piece of legislation was a means to measure its effectiveness known as the New Job Creation Tax Credit—which provided businesses with a $3,000 tax credit for each of up to three years if they created jobs that paid good wages and provided health insurance and that were a result of a significant capital investment. The exact language from the Joint Legislative Budget Committee Summary is below:
Creation of a New Job Tax Credit
This provision provides a $3,000 annual tax credit for each net new qualifying job added by an employer in the state. To qualify for the $3,000 credit, which can be claimed for 3 years, the new employment position must: (1) be full-time, (2) pay at least the median wage, and (3) offer health insurance paid by the employer (at least 65% of premium). Additionally, a business cannot claim the new credit unless it adds at least 25 net new jobs in a year in an urban area (5 new jobs in rural area) and makes a capital investment of at least $5 million ($1 million in rural area). No employer is allowed to claim more than 400 jobs in the first year of credit use, 800 jobs in the second year, and 1,200 jobs in the third year. The bill provides a statewide aggregate credit cap of 10,000 jobs in FY 2013 ($30 million) and grows by an additional 10,000 jobs in both FY 2014 ($60 million) and FY 2015 ($90 million).
The cost of the credit is estimated to be $6.7 million for half a year in FY 2012, $13.4 million in FY 2013, and growing to $47.7 million in FY 2015. The estimates reflect applying the credit against baseline jobs. The baseline represents the “natural growth” in net new jobs, as forecast by the University of Arizona (UofA), which would occur regardless of the tax incentive. While UofA forecasts a net job gain of 79,200 positions in 2012, the bill’s wage and health insurance requirements would reduce the number of credit eligible jobs to 29,700. The credit cap, along with the minimum net new employment and investment requirements, and other factors, such as insufficient tax liability and initial unawareness of the credit’s existence, are estimated to further reduce the credit use to about 4,500 employment positions, for a cost of $13.4 million in FY 2013.
If this tax bill stimulates the creation of new jobs above the baseline forecast, the new job credit will have a greater cost. The cost of these “above the baseline” tax credits will be offset by the withholding and other related new taxes generated by these new jobs.
Before final passage, the credit was renamed the New Employment Tax Credit. Since 2011 it has been broadened and extended. In 2012, the individual employer caps were removed, though the global cap of 10,000 ($30 million in additional credits) was retained. The cost could still exceed $30 million since a job could receive up to $9,000 in tax credits spread across three years and employers could carry them over for up to five years. In 2014 it was amended so that the credit was tied to the position as opposed to a specific employee as long as the position was not vacant for more than 90 days. In 2017, the bill’s sunset period was extended from 2017 to 2025 and a tiered system for lower capital investment was introduced as long as the lower levels of investment were accompanied by higher paid jobs.
The JLBC economic adjustment of the University of Arizona projections indicated that just under 6 percent of new employment would likely qualify for this credit.
The JLBC following the University of Arizona projections were based on “natural growth” which was based on Arizona’s prior employment growth during expansions and was designed to assume the Jobs Bill had no impact on economic activity. JLBC estimated a “natural growth” in new jobs which would have occurred anyway. This estimate compared with the actual use of the Tax Credit is shown in Table 1. We can now contrast that “natural growth” of employment with actual nonfarm employment growth with the estimated use of the credit and the actual use of the credit.
Each employer is eligible to use the credit for up to three years—so growth across years does not necessarily represent added jobs, but can be the continuance of ones from the prior year.
Table 1

As is demonstrated in the above table actual claimants for the tax credit have been relatively small compared to projections. The projected eligibility may have been too generous, but since the use of the New Employment Tax Credit has been at most about half projections in FY2012 and FY2013 and often one-fifth or worse since then, the New Employment Tax Credit fails to provide any evidence that the Jobs Bill helped spur Arizona’s economic recovery.
If we assume 5.7 percent of actual net new employment would have qualified for this credit as the JLBC analysis in 2011 presupposed, we can compare the anticipated number of jobs created with actual growth as shown in Table 2 below.
In 2011 the University of Arizona analysis may have not foreseen the more tepid nature of the national recovery. Nonetheless, as Table 2 shows actual employment growth in Arizona was only two-thirds of the “natural growth” prediction and does not suggest that the Jobs Bill was an economic stimulus.
Table 2
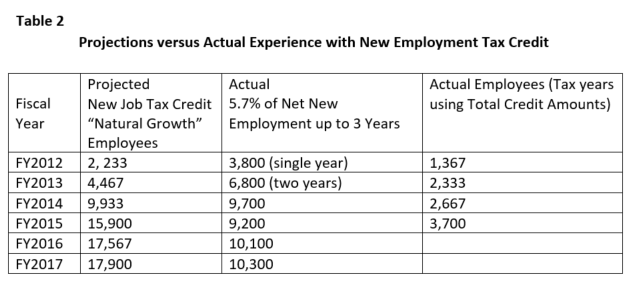
Actual state employment growth has lagged below the “natural growth” estimated by the JLBC in 2011. Taking the actual amount of credits employers were eligible for and dividing by $3,000 yields actual employees and as can be seen in the third column. Arizona’s employment performance here is far less with about one-third of the actual employment growth actually translating into jobs being eligible for the tax credit. By any indicator, this would suggest the Jobs Bill failed to spur economic growth beyond baseline growth.
Arizona’s Job and Revenue Performance Lag Behind Neighboring States
To complete the economic analysis of the Jobs Bill, Arizona’s performance should be compared with neighboring states in the region. If Arizona outperformed neighboring states then that would support the Jobs Bill as a supply-side economic stimulus.
Arizona borders five states: California, Nevada, Utah, Colorado and New Mexico. All of these states have generally had robust economies with New Mexico frequently lagging. All have experienced population growth. However, New Mexico’s population is growing at a very slow rate, and while California continues to grow its population growth rate has slowed to around 1 percent per year. The other states tend to grow at or above 1 percent per year. For regional comparisons these states share much in common. Nevada and Arizona both have the advantage of being in close proximity to the California border and its huge market, offering a lower cost of living and cost of business alternative. Arizona has superior water supplies than Nevada and boasts the international border with Mexico as additional advantages. Colorado has one of the most educated populations in the country with California and Utah being closer to the national average, and Arizona, Nevada and New Mexico trailing. Utah has the lowest poverty levels despite having a lower median income than Colorado. Utah is also the least ethnically diverse state but all states are experiencing increased ethnic diversity, mainly driven by a growing Hispanic population.
How has Arizona’s economic performance compared with these other states?
2010 is used as the baseline, since all of the states experienced positive employment growth starting from that year. Looking at employment growth since June 2010, Arizona has had the second worst employment growth, the second worst state revenue growth, and by far the worst performance in Corporate Income Tax revenue compared to the other states.
Setting aside Utah which had the highest employment growth rate (24%) and New Mexico which had the lowest (3%), if Arizona had followed the average employment growth of California, Nevada and Colorado by June of 2017 the state would have had 70,000 more jobs than it actually had as depicted in the Figure 4 below.
Figure 4
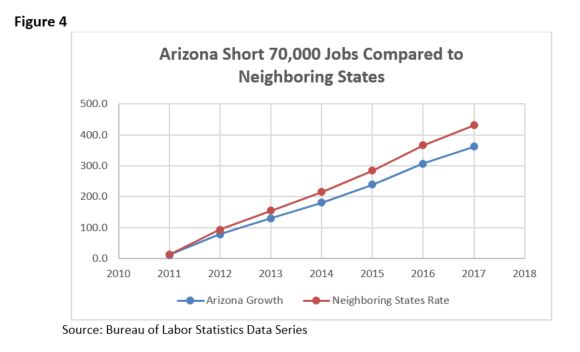
If one considers revenue relative to employment gains, Arizona falls far short of other states. A key difference has been that Arizona is the only state which has lost revenue cumulatively over the period 2010-2017 from the corporate income tax.
Figure 5 below illustrates that including Prop. 100, the temporary one cent sales tax, Arizona’s revenue growth only exceeds New Mexico, which has had scant population growth. When the temporary tax is excluded, Arizona’s revenue growth falls well below all five neighboring states.
Figure 5
State of the State Budget: Key Funding Shortfalls
One Billion Dollar K-12 Education Funding Shortfall Despite Prop. 123
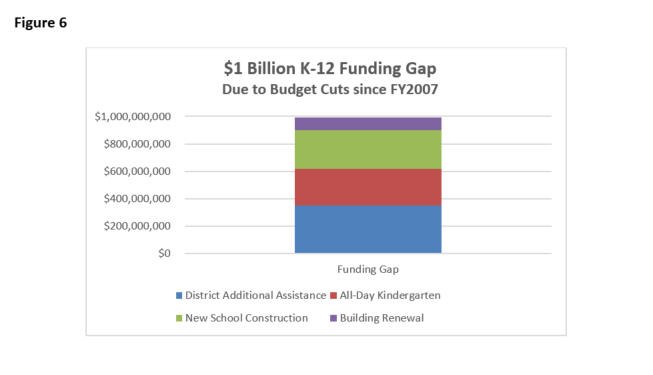
FY 2007 was a peak year for recent education funding, so is a benchmark to measure the degree to which current appropriations match it when adjusted for the number of students and inflation. This aspect focuses on those elements excluded from Prop. 123. Areas outside the inflation adjusted base level include money for computers and textbooks formerly known as Soft Capital and now called District Additional Assistance. Following the Roosevelt v. Bishop Case, the state also took on more responsibility for school repairs and construction. Finally, Governor Napolitano was successful in getting the funding for all-day Kindergarten included. That was rescinded when stimulus money ran out, despite a temporary sales tax, and the state returned to funding only a half-day of Kindergarten. The District Additional Assistance shortfall is noted as a suspended statutory formula in the 2018 JLBC Tax Booklet. All-day Kindergarten cost is estimated by taking the amount spent in FY2010, the last year it was funded, and adjusting it for the change in base funding as well the growth in students. Building renewal and New School construction take the FY2007 appropriation and adjust it for the growth in students as well as the change in the implicit GDP price deflator (inflation). This yields about a $1 billion shortfall (see Figure 6).
• Soft Capital and Capital Overlay now known as District Additional Assistance: $352 million
• All-day Kindergarten: $265 million
• New School Construction: $284 million
• Building Renewal Funds: $90 million
Total $991 million
Figure 6
$233 million to Meet ABOR model after Per Pupil Funding Cut in Half
University per pupil funding has been cut by half. Universities have borne a disproportionate share of the cuts because unlike K-12 education and Medicaid, they are not funded by formula.
However, could a future lawsuit be looming? Not the one put forward by the Attorney General Mark Brnovich, who sued the Arizona Board of Regents (ABOR), but one which sues the legislature for failing to provide sufficient resources.
Take two provisions from the Arizona Constitution:
The revenue for the maintenance of the respective state educational institutions shall be derived from the investment of the proceeds of the sale, and from the rental of such lands as have been set aside by the enabling act approved June 20, 1910, or other legislative enactment of the United States, for the use and benefit of the respective state educational institutions. In addition to such income the legislature shall make such appropriations, to be met by taxation, as shall insure the proper maintenance of all state educational institutions, and shall make such special appropriations as shall provide for their development and improvement.
And “instruction shall be as nearly free as possible.”
Figure 7
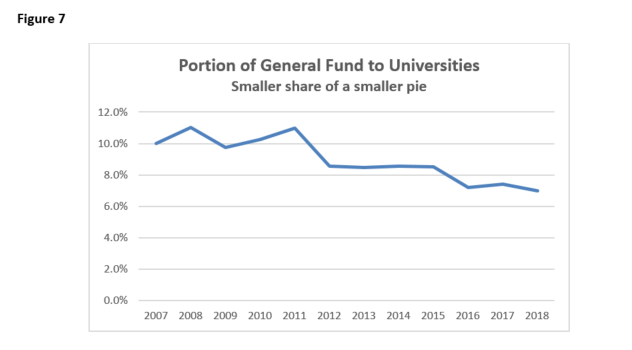
Following a $100 million cut in university allocations in FY2016, put together a proposed new funding model that the state fund half the cost of in-state students. Presently, the General Fund provides 34 percent of the average educational cost of in-state students ($5,302 of $15,550). Reaching 50 percent would require a $234 million improvement. In the past two fiscal years the state has provided no meaningful movement forward on this proposal, so how the state investments meet the “development and improvement” criteria of the Constitution looks increasingly dubious if the legislature continues to spurn ABOR’s funding model. See Figure 7.
$15 million Initially to address Continued Challenges in Child Protection
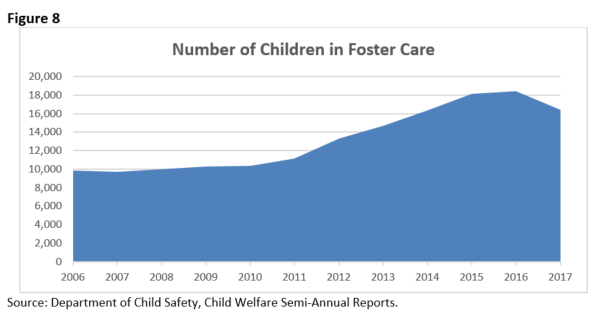
While the number of children in out-of-home placements under the Dept. of Child Safety showed significant declines, staffing turnover remains a significant issue with the Nov. 2016 to Oct. 2017 turnover among Child Welfare Specialists at 37.42 percent. These jobs are critically important but staff members are both overworked and undercompensated—consequently they leave. That lack of continuity undermines child welfare for children who need stable connections with adults for their own development and sense of security. The agency should set a goal of reducing turnover to 20 percent and identify the needed resources to do so—generally that would be substantial financial resources. In November 2017 there were 1,329 specialists (and 77 vacancies). Providing each of those workers a $10,000 raise, which is the minimum to begin to move the pay into an appropriate level, would cost about $15 million. The first step is to raise the pay. Then staffing needs to be increased. But without higher pay, those hired won’t stick around.
Figure 8
State of the State Budget: Improving Allocations
Applying Public Procurement Procedures to Charter Schools
Charter school enrollment growth continues to outpace district schools. More than $1 billion annually is allocated to the state’s charter schools, which unlike districts schools, are 100 percent funded by the state’s General Fund. Consequently, the General Fund cost per student goes up each year as the portion of students in charter schools increase (cost of $17 million last fiscal year).
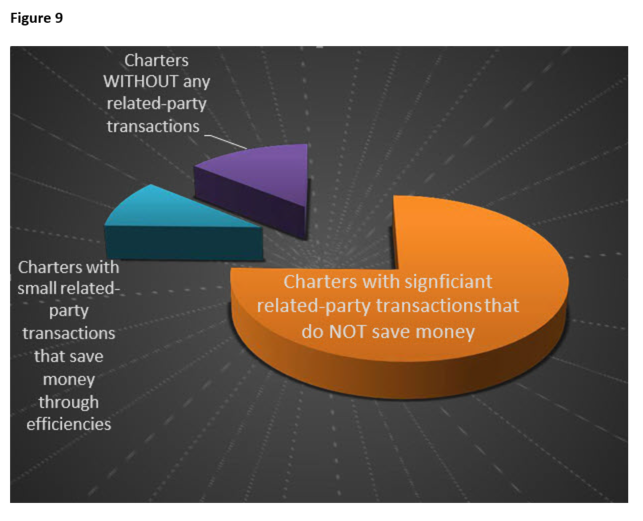
Charter holders are held to different financial oversight standards than district schools. For instance, employees of a district school cannot sit on the school’s governing board. Nor can a district school do business with the for-profit entity owned by a governing board member or an employee of the district. Both of those transactions are legal for charter schools. Consequently, charter holders set up their own for-profit companies and then contract with them outside of any competitive bid process. There is no effective oversight of this practice, because as a currently legal transaction, it is outside the scope of the Arizona State Board for Charter Schools.
The Grand Canyon Institute’s September 2017 report, Following the Money: Twenty Years of Charter School Finances in Arizona, found that three-fourths of the state’s charter holders were engaged in questionable related party transactions outside of the competitive bidding process involving monies approaching half a billion dollars. If for instance, the expenditures were 10 percent greater than they would have been under a competitive bid system, then the lack of financial oversight costs taxpayers close to $50 million a year.
The way to correct this problem is to require that charters follow the same public procurement system as district schools and authorize the Arizona State Board for Charter Schools to develop procedures to assist those schools for which this would be an undue burden. The impact would be two-fold. All current self-dealing would become part of the public record through competitive bidding as requisites for the bid would need to be developed and submitted. Second, those charter holders who would prefer to avoid competitive bidding would be incentivized to stop using private for-profit entities, and bring these services back into their schools directly (pure classification change), which would make these expenditures subject to annual audits.
Figure 9
Up to $150 million: Capping or Eliminating Private School Tax Credits
During 2018, the Grand Canyon Institute will have a full update on its analysis of the actual cost of private school tax credits. Proponents of private school tax credits argue that because the average scholarship amount or the voucher amount for Empowerment Scholarship Accounts (ESAs) are less than what the state expends for charter and district pupils that the state saves money. This logic is problematic because private school enrollment existed before these programs existed and would continue to occur without these programs. In fact, as shown in Figure 10, private school enrollment has been flat for 20 years despite the program, and, in fact, the portion of Arizona students attending private schools has declined during the program’s existence. For FY2017 private school tax credits totaled about $150 million.
Figure 10
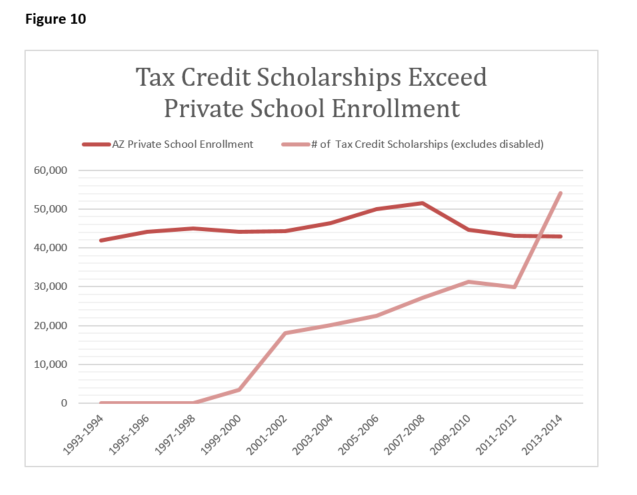
The Grand Canyon Institute’s analysis in 2016 found that through 2013-2014, that despite growth in the program, including the expansion of individual and corporate tax credits, that enrollment not grown. Using 2013-2014 data, the most recent data available, the number of scholarships granted through these programs now significantly exceeds the number of private students enrolled, confirming that students are receiving multiple scholarships (See Figure 10).
Private school enrollment has been declining nationwide relative to total enrollment. Catholic Schools nationwide have the sharpest decline. Some analysts suggest this is due to priest scandals and the movement of Catholics on the East coast to the suburbs. Another factor is the growth of charter schools. In many parts of the country, charter schools are primarily in inner cities. In Arizona the opposite is the case with many charters in suburban areas. Arizona has the largest portion of school-age children enrolled in charter schools in the country. Some private schools switch to charters (as Scottsdale Country Day School did a few years ago) or charters emerge as an alternative to private schools. Arizona’s charter schools and substantial charter school enrollment growth should depress private school enrollment.
By contrast, the proliferation of private school tuition tax credit scholarships should expand private school enrollment. Regression analysis was used to control for the impact of charter schools on private schools. That analysis estimates that the cost for Arizona taxpayers per student enrolled due to the credit is about $10,000 from the General Fund. This amount far exceeds the General Fund and local contributions to educate students in the public school system. This estimate that there is a positive impact from the tuition scholarship program (as opposed to no effect) meets a 90 percent confidence interval, which is lower than the threshold normally accepted (95 percent is the norm).
$80 million: Enhance Audit Staffing in the Arizona Department of Revenue
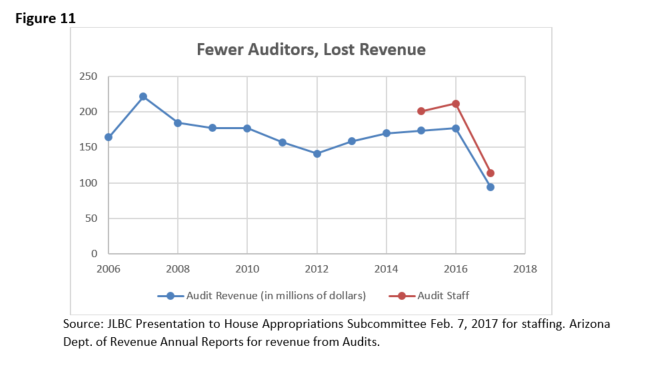
In late 2016, the Arizona Dept. of Revenue reportedly had dropped from 30 to 4 corporate auditors. In October 2017 that number was reported to be still only 6. Consequently, as the Grand Canyon Institute’s Elliott Hibbs, a former director of the Arizona Dept. of Revenue, had warned in February 2017, corporate audit collections dropped precipitously from $34 million in 2016 to $6 million in 2017 and total audit amounts dropped dramatically by $80 million. Reportedly the Arizona Dept. of Revenue now has 11 corporate auditors. This reduction in revenue was completely avoidable if more effort had been made to assure proper staffing. The state legislature voted down amendments to the budget to hire more auditors in the last budget. The total number of auditors ought to return to 30 and including all necessary support staff and people in collections, total staffing in the Dept. of Revenue should increase to levels at minimum from FY2016.
As illustrated in Table 3, the number of employees in the Audit division dropped nearly in half in FY2017 which as shown in Figure 11 corresponds with the marked decline in audit-derived revenue. Claims from the Dept. of Revenue that auditing staffing numbers dos not correlate with audit revenue is not supported by this data.
Table 3
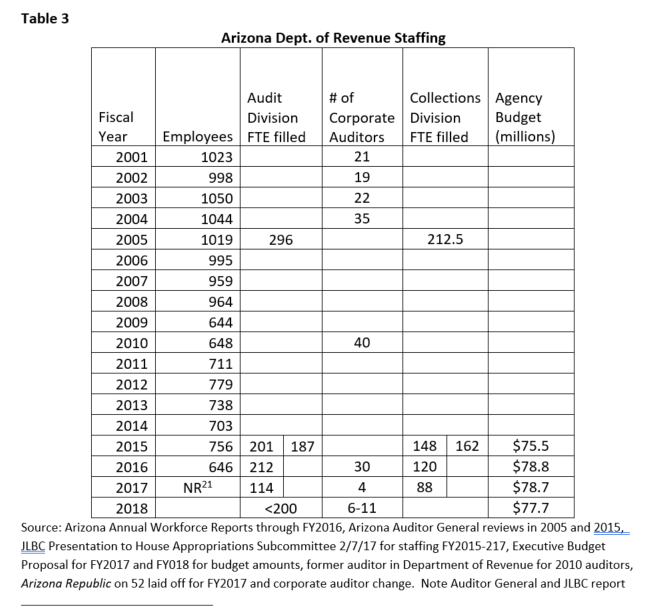
Figure 11
$55 Million: Move to Earned Release for Nonviolent Offenders
Ten years ago Arizona was one of only two states in the country to apply “Truth in Sentencing” to nonviolent offenders. Mississippi was the other. However, Mississippi determined the policy fiscally ineffective and made substantial changes. In 2001, Mississippi restored parole-eligibility to first-time nonviolent offenders after they had served a quarter of their sentence. This was expanded in 2008 to include all nonviolent offenders including those convicted of selling small quantities of drugs. Of the 3,100 individuals released from 2008 through 2009, only 121 had been returned to prison as of 2010, and only five of those were for new crimes, the remainder was for parole violations. Mississippi’s changes have saved the state an estimated $200 million.
The Washington State Institute for Public Policy (WSIPP) studied the impact of their 2003 law that increased earned release credits for nonviolent offenders from 33 percent to 50 percent of their sentence, and they found a net public safety benefit and significant taxpayer savings compared to a matched control group. Their only inferred cost of reducing sentences, an assumed increase in property crimes from shorter sentences can be effectively mitigated by transitioning prisoners to appropriate levels of community supervision based on their potential recidivism and providing adequate transitional services to ensure a more successful reintegration into society.
Earned release credits require participants to exhibit good conduct, and participate in ADC programs such as work, education, drug treatment, and other approved programs. Credits can be lost as a consequence of inappropriate behavior. Hence, these programs give inmates an incentive to behave and improve themselves. Community supervision also helps move inmates into the workforce and enables restitution payments, community service, as well as partial reimbursement for monitoring costs, such as use of GPS tracking devices.
About one-fifth of those incarcerated by ADC who have never been convicted of a violent offense and are classified as “low risk”, “very low risk”, or “ultra low risk” of recidivism and do not have ICE detainers. Assuming Arizona adopted an earned release rate where sentences could be cut in half and presuming that currently low risk nonviolent under current law serve 85 percent of their sentence behind bars, then 40 percent of this population group at any point once fully implemented would be moved to community supervision with drug treatment as needed, yields $55 million in savings.
Dave Wells holds a doctorate in Political Economy and Public Policy and is the Research Director for the Grand Canyon Institute, a centrist fiscal policy think tank founded in 2011. He can be reached at DWells@azgci.org or contact the Grand Canyon Institute at (602) 595-1025, ext. 2.
 Budget


